Cerebral Venous Sinus Thrombosis
Barbara Simons, Geert Lycklama a Nijeholt and Robin Smithuis
Radiology department of the Medical Centre Haaglanden in the Hague and the Rijnland hospital in Leiderdorp, the Netherlands
Publicationdate
Cerebral venous thrombosis is an important cause of stroke especially in children and young adults.
It is more common than previously thought and frequently missed on initial imaging.
It is a difficult diagnosis because of its nonspecific clinical presentation and subtle imaging findings.
In this article we will focus on:
- Findings on routine imaging that should make you think of unsuspected venous thrombosis.
- How to image patients in suspected venous thrombosis.
- Pitfalls.
Introduction
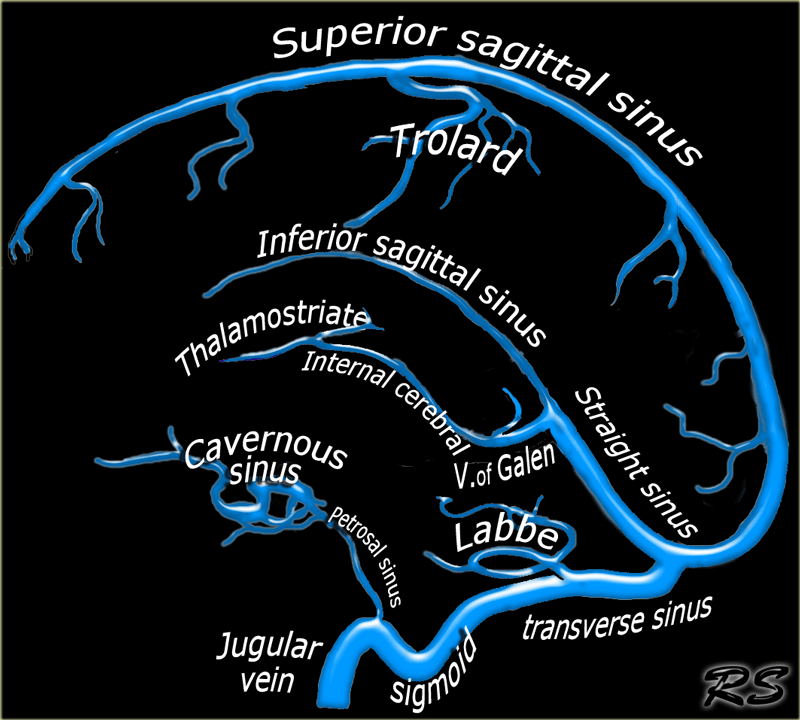
Cerebral venous thrombosis is located in descending order in the following venous structures:
-
Major dural sinuses:
Superior sagittal sinus, transverse, straight and sigmoid sinuses. -
Cortical veins:
- Vein of Labbe, which drains the temporal lobe.
- Vein of Trolard, which is the largest cortical vein that drains into the superior sagittal sinus.
-
Deep veins:
Internal cerebral and thalamostriate veins. - Cavernous sinus.
Clinically patients with cerebral venous thrombosis present with variable symptoms ranging from headache to seizure and coma in severe cases.
In neonates shock and dehydration is a common cause of venous thrombosis.
In older children it is often local infection, such as mastoiditis, or coagulopathy.
In adults, coagulopathies is the cause in 70% and infection is the cause in 10% of cases.
In women, oral contraceptive use and pregnancy are strong risk factors.
When to think of venous thrombosis
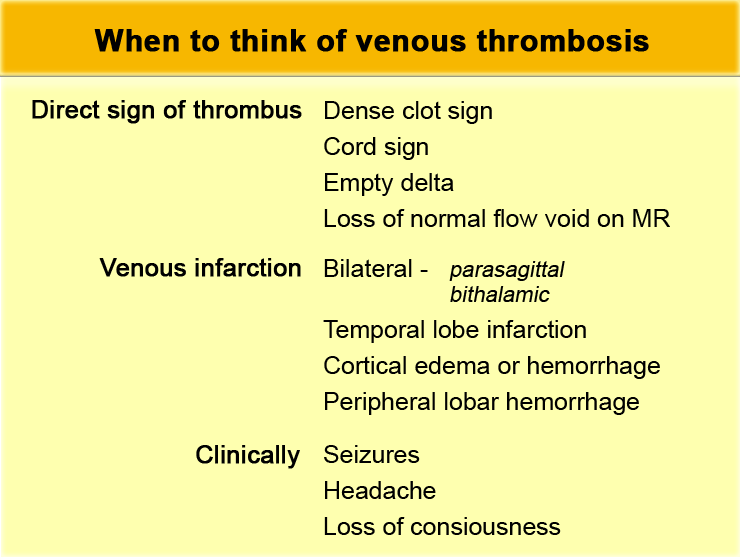
Venous thrombosis has a nonspecific presentation and therefore it is important to recognize subtle imaging findings and indirect signs that may indicate the presence of thrombosis.
Although these findings are often present on initial scans, they are frequently detected only in retrospect.
Clinically patients with venous thrombosis often present with seizures, which is not a symptom in patients with an arterial infarction.
On a routine non-enhanced MR or CT you should think of the possibility of venous thrombosis when you see:
- Direct signs of a thrombus
- Infarction in a non-arterial location, especially if it is bilateral and hemorrhagic
- Cortical or peripheral lobar hemorrhage
- Cortical edema
Dense clot sign
Direct visualization of a clot in the cerebral veins on a non enhanced CT scan is known as the dense clot sign.
It is seen in only one third of cases.
Normally veins are slightly denser than brain tissue and in some cases it is difficult to say whether the vein is normal or too dense (see pitfalls).
In these cases a contrast enhanced scan is necessary to solve this problem.
 Dense clot sign in a thrombosed cortical vein.
Dense clot sign (2)
Visualization of a thrombosed cortical vein that is seen as a linear or cord-like density, is also known as the cord sign.
Another term that is frequently used, is the dense vessel sign.
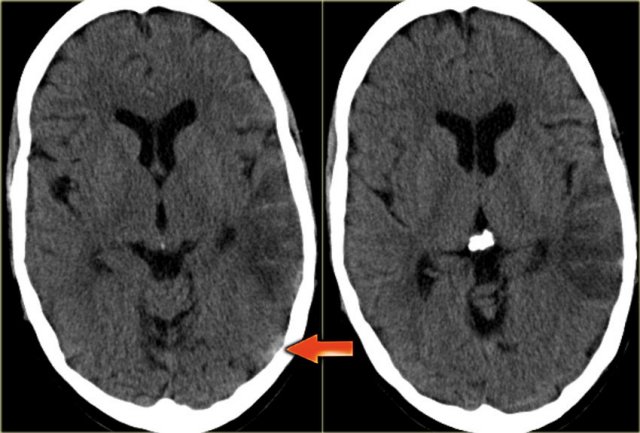
Dense clot sign (3)
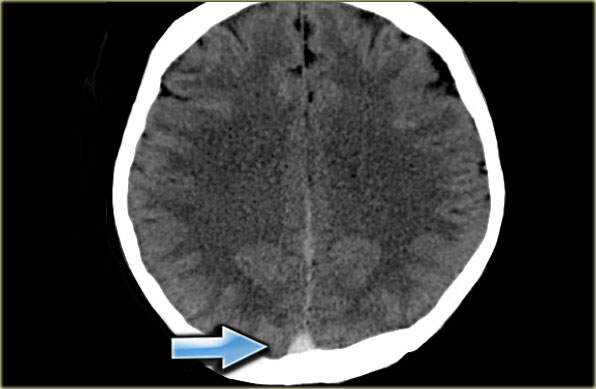
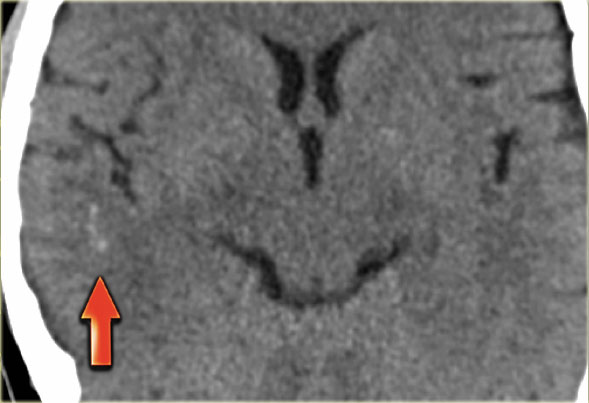
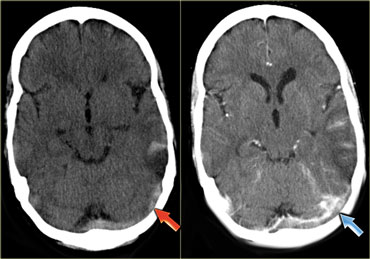
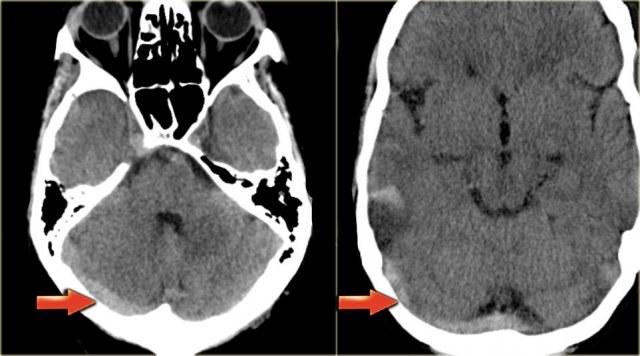
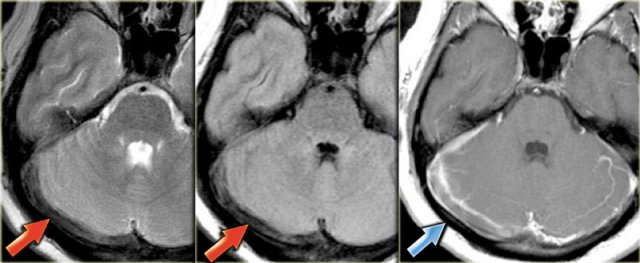
On the left images of a patient with a hemorrhagic infarction in the temporal lobe (red arrow).
Notice the dense transverse sinus due to thrombosis (blue arrows).
 Two cases of empty delta sign due to thrombosis of the superior sagittal sinus.
Empty delta sign
The empty delta sign is a finding that is seen on a contrast enhanced CT (CECT) and was first described in thrombosis of the superior sagittal sinus.
The sign consists of a triangular area of enhancement with a relatively low-attenuating center, which is the thrombosed sinus.
The likely explanation is enhancement of the rich dural venous collateral circulation surrounding the thrombosed sinus, producing the central region of low attenuation.
In early thrombosis the empty delta sign may be absent and you will have to rely on non-visualization of the thrombosed vein on the CECT.
The sign may be absent after two months due to recanalization within the thrombus.
Empty delta sign (2)
On the left a case of thrombosis of the right transverse sinus and the left transverse and sigmoid sinus (arrows).
There is enhancement surrounding the thrombosed hypoattenuating veins.
 Venous thrombosis with absence of normal flow void on T2-weighted image..
Absence of normal flow void on MR
On spin-echo images patent cerebral veins usually will demonstrate low signal intensity due to flow void.
Flow voids are best seen on T2-weighted and FLAIR images, but can sometimes also be seen on T1-weighted images.
A thrombus will manifest as absence of flow void.
Although this is not a completely reliable sign, it is often one of the first things, that make you think of the possibility of venous thrombosis.
The next step has to be a contrast enhanced study.
On the left a T2-weighted image with normal flow void in the right sigmoid sinus and jugular vein (blue arrow).
On the left there is abnormal high signal as a result of thrombosis (red arrow).
 Venous thrombosis with absence of normal flow void on T1-weighted image.
Absence of normal flow void on MR (2)
The images on the left show abnormal high signal on the T1-weighted images due to thrombosis.
The thrombosis extends from the deep cerebral veins and straight sinus to the transverse and sigmoid sinus on the right.
Notice the normal flow void in the left transverse sinus on the right lower image.
Absence of normal flow void on MR-images can be very helpful in detecting venous thrombosis, but there are some pitfalls as we will discuss later.
Slow flow can occur in veins and cause T1 hyperintensity.
Venous infarction
The other sign that can help you in making the diagnosis of unsuspected venous thrombosis is venous infarction.
Venous thrombosis leads to a high venous pressure which first results in vasogenic edema in the white matter of the affected area.
When the proces continues it may lead to infarction and development of cytotoxic edema next to the vasogenic edema.
This is unlike in an arterial infarction in which there is only cytotoxic edema and no vasogenic edema.
Due to the high venous pressure hemorrhage is seen more frequently in venous infarction compared to arterial infarction.
Since we are not that familiar with venous infarctions, we often think of them as infarctions in an atypical location or in a non-arterial distribution.
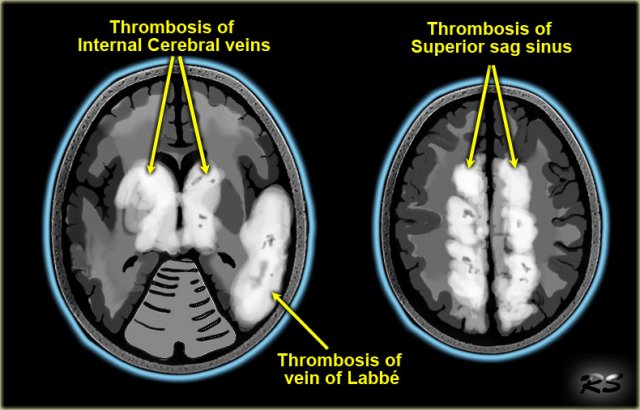
However venous infarctions do have a typical distribution, as shown on the left.

Since many veins are midline structures, venous infarcts are often bilateral.
This is seen in thrombosis of the superior sagittal sinus, straight sinus and the internal cerebral veins.
 Bilateral infarction in superior sagittal sinus thrombosis
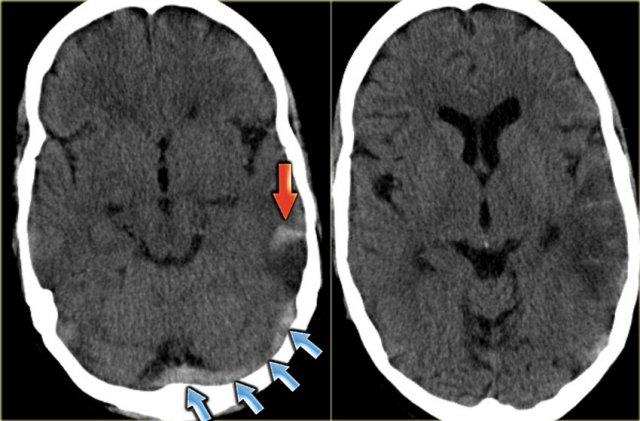
Venous infarction (2) - Superior sagittal sinus thrombosis
The most frequently thrombosed venous structure is the superior sagittal sinus.
Infarction is seen in 75% of cases.
The abnormalities are parasagittal and frequently bilateral.
Hemorrhage is seen in 60% of the cases.
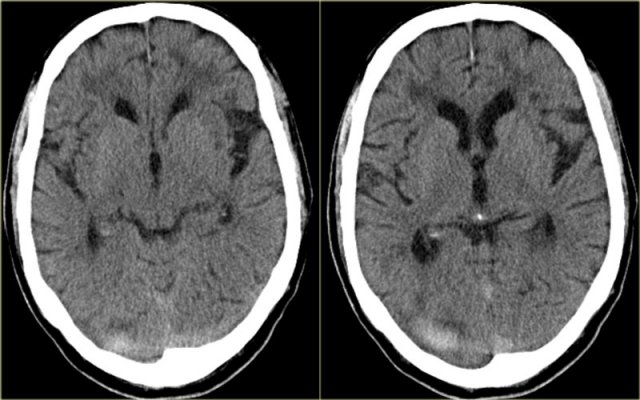
On the left bilateral parasagittal edema and subte hemorrhage in a patient with thrombosis of the superior sagittal sinus.
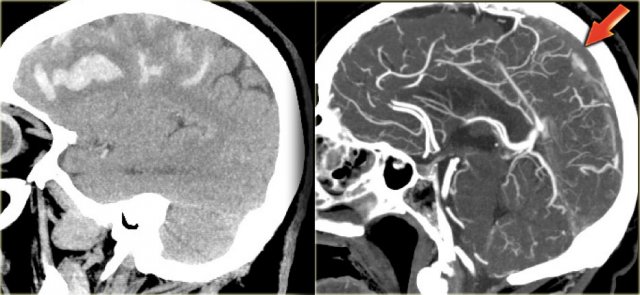
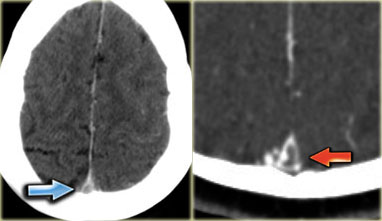
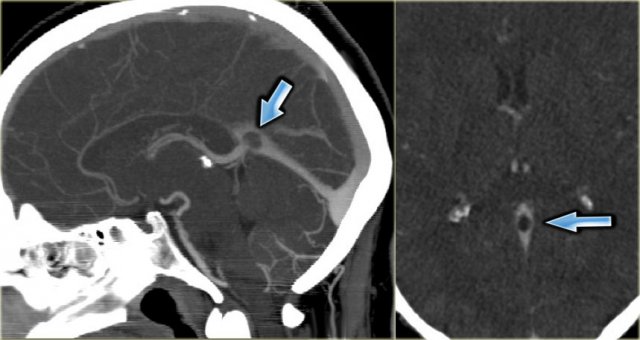
On the left reconstructed sagittal CT-images in a patient with bilateral parasagittal hemorrhage due to thrombosis of the superior sagittal sinus.
The red arrow on the contrast enhanced image indicates the filling defect caused by the thrombus.
 Venous infarct in Labbe territory
Venous infarcts (3) - vein of Labbe
Another typical venous infarction is due to thrombosis of the vein of Labbe.
On the left images demonstrating hypodensity in the white matter and less pronounced in the gray matter of the left temporal lobe.
There is a broad differential diagnosis including arterial infarction, infection, tumor etc.
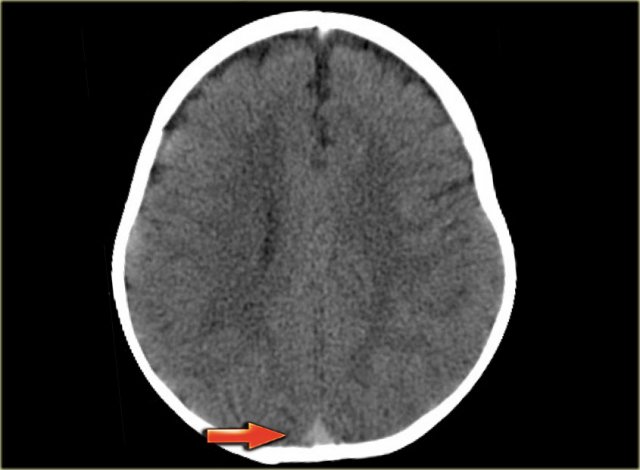
Notice that there is some linear density within the infarcted area.
This is due to hemorrhage.
In the differential diagnosis we also should include a venous infarct in the territory of the vein of Labbe.
The subtle density in the area of the left transverse sinus (arrow) is the key to the diagnosis.
This is a direct sign of thrombosis and the next step is a CECT, which confirmed the diagnosis (not shown).
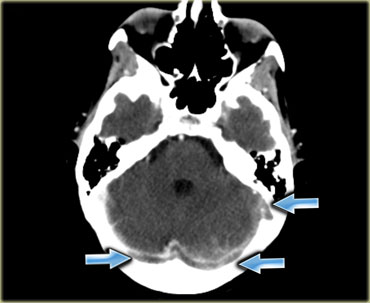
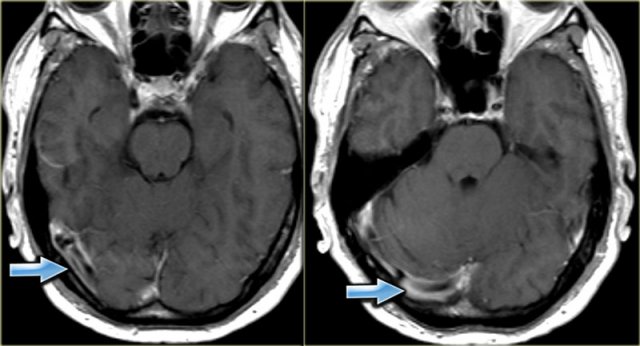
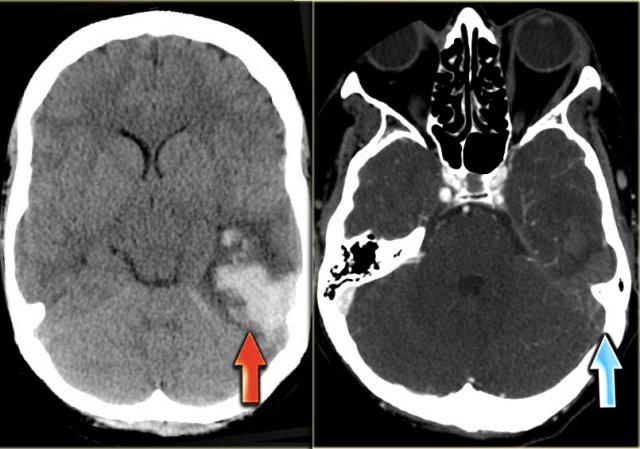 Hemorrhagic venous infarct in Labbe territory
On the left images of a patient with hemorrhage in the temporal lobe.
When the hemorrhagic component of the infarction is large, it may look like any other intracerebral hematoma with surrounding vasogenic edema.
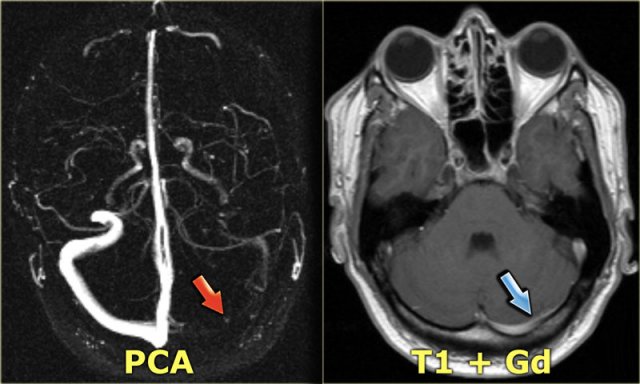
The clue to the diagnosis in this case is seen on the contrast enhanced image, which nicely demonstrates the filling defect in the sigmoid sinus (blue arrow).
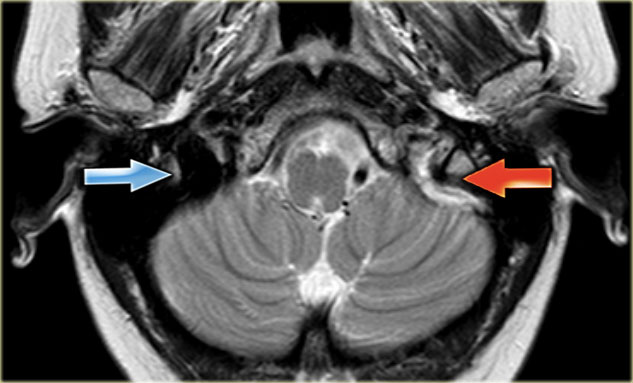
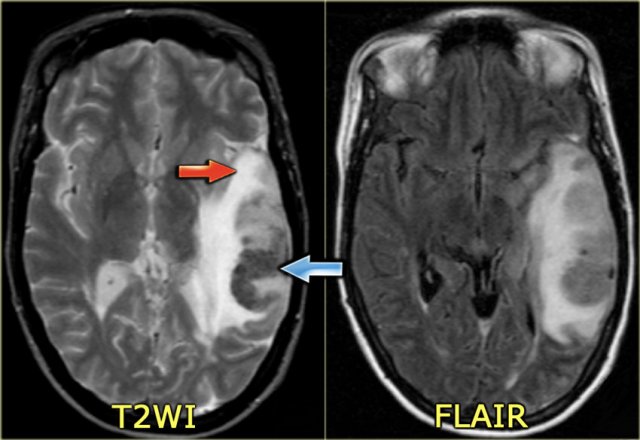 Hemorrhagic venous infarct in Labbe territory
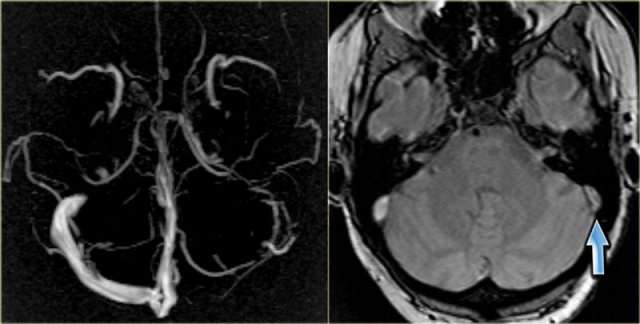
On the left a similar case on MR.
There is a combination of vasogenic edema (red arrow), cytotoxic edema and hemorrhage (blue arrow).
These findings and the location in the temporal lobe, should make you think of venous infarction due to thrombosis of the vein of Labbe.
The next examination should be a contrast enhanced MR or CT to prove the diagnosis.
 Venous thrombosis of vein of Galen and straight sinus
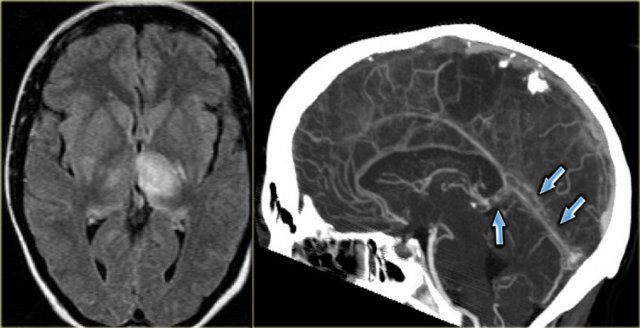
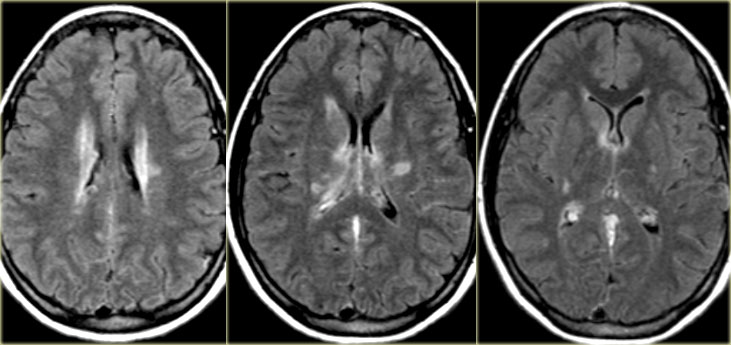
Venous infarction (4) - Deep cerebral veins
On the far left a FLAIR image demonstrating high signal in the left thalamus.
When you look closely and you may have to enlarge the image to appreciate this, there is also high signal in the basal ganglia on the right.
These bilateral findings should raise the suspicion of deep cerebral venous thrombosis.
A sagittal CT reconstruction demonstrates a filling defect in the straight sinus and the vein of Galen (arrows).
On the left a young patient with bilateral abnormalities in the region of the basal ganglia.
Based on the imaging findings there is a broad differential including small vessel disease, demyelinisation, intoxication and metabolic disorders.
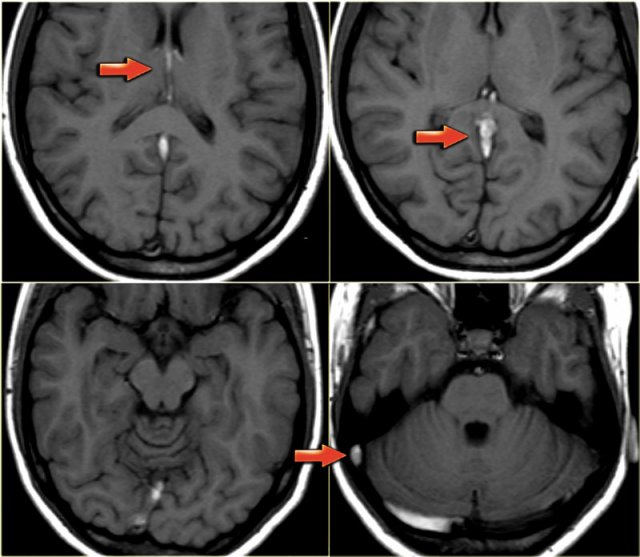
Continue with the T1-weighted images in this patient.
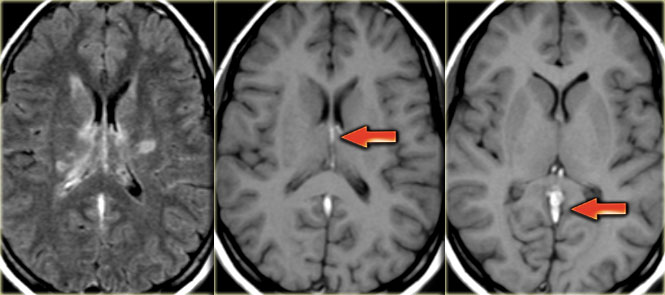 Bilateral infarctions in the basal ganglia due to deep cerebral venous thrombosis
Notice the abnormal high signal in the internal cerebral veins and straight sinus on the T1-weighted images, where there should be a low signal due to flow void.
This was unlike the low signal in other sinuses.
The diagnosis is bilateral infarctions in the basal ganglia due to deep cerebral venous thrombosis.
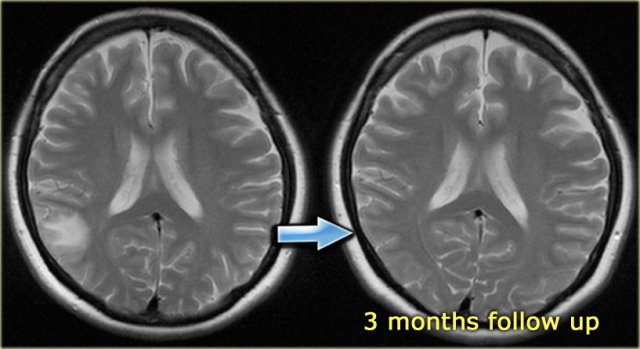
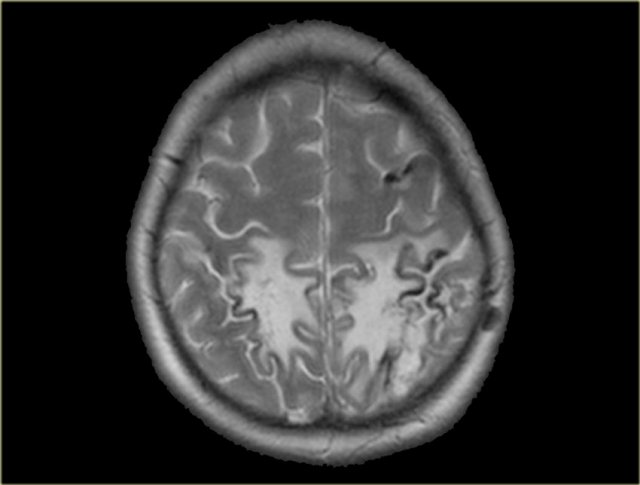
Venous infarction (5) - Edema
In some cases of venous thrombosis the imaging findings can resolve completely.
On the left a patient with a subcortical area of high signal intensity.
The first impression was that this could be a low grade glioma.
On a follow up scan the abnormalities had resolved completely.
In retrospect a dense vessel sign was seen in one of the cortical veins and the diagnosis of venous thrombosis was made.
The high signal intensity can be attributed to vasogenic edema due to the high venous pressure that resulted from the thrombosis.
Imaging in suspected thrombosis
CT-venography
CT-venography is a simple and straight forward technique to demonstrate venous thrombosis.
In the early stage there is non-enhancement of the thrombosed vein and in a later stage there is non-enhancement of the thrombus with surrounding enhancement known as empty delta sign, as discussed before.
Unlike MR, CT-venography virtually has no pitfalls.
The only thing that you don't want to do, is to scan too early, i.e. before the veins enhance or too late, i.e. when the contrast is gone.
Some advocate to do a scan like a CT-arteriography and just add 5-10 seconds delay.
To be on the safe side we advocate 45-50 seconds delay after the start of contrast injection.
We use at least 70 cc of contrast.
On the left some images of a CT-venography demonstrating thrombosis in many sinuses.
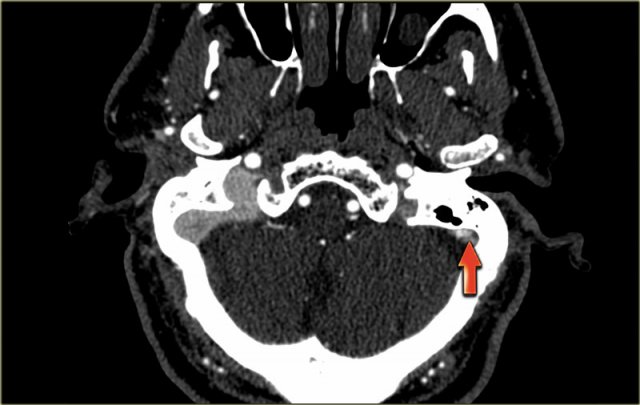
On the left images of a patient with an infarction in the area of the vein of Labbe.
On the non-enhanced images you can appreciate the dense thrombus within the transverse sinus and the hemorrhage in the infarcted area.
On the enhanced images a filling defect can be seen in the transverse sinus.
You can scroll through the images.
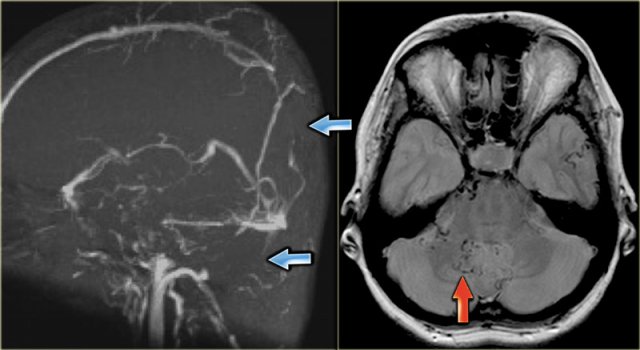
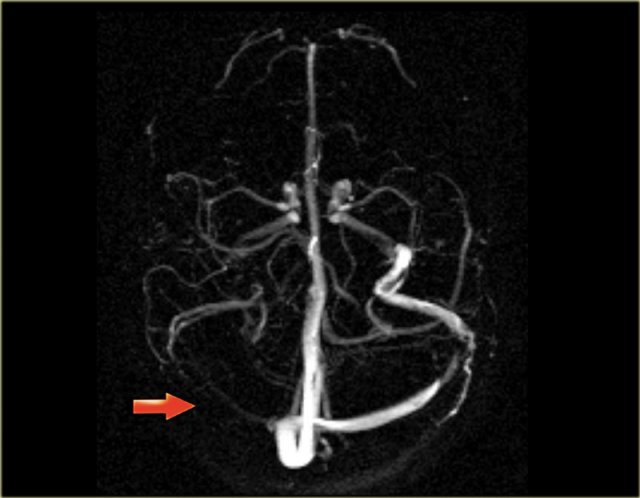 Transverse MIP image of a Phase-Contrast angiography.The right transverse sinus and jugular vein have no signal due to thrombosis.
MR-venography
The MR-techniques that are used for the diagnosis of cerebral venous thrombosis are:
Time-of-flight (TOF), phase-contrast angiography (PCA) and contrast-enhanced MR-venography:
-
Time-of-Flight angiography is based on the phenomenon of flow-related enhancement of spins entering into an imaging slice.
As a result of being unsaturated, these spins give more signal that surrounding saturated spins. - Phase-contrast angiography uses the principle that spins in blood that is moving in the same direction as a magnetic field gradient develop a phase shift that is proportional to the velocity of the spins.
This information can be used to determine the velocity of the spins. This image can be subtracted from the image, that is acquired without the velocity encoding gradients, to obtain an angiogram. - Contrast-enhanced MR-venography uses the T1-shortening of Gadolinium.
It is similar to contrast-enhanced CT-venography.
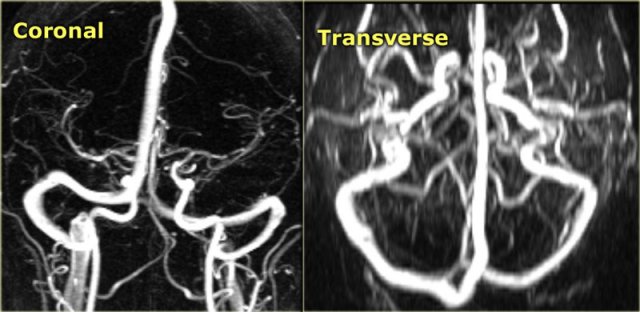
When you use MIP-projections, always look at the source images.
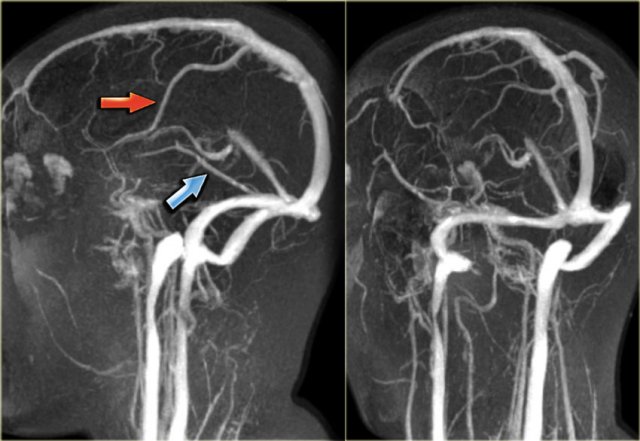
On the left a lateral and oblique MIP image from a normal contrast-enhanced MR venography.
Notice the prominent vein of Trolard (red arrow) and vein of Labbe (blue arrow).
Every MR techniques has its own pitfalls as we will discuss in a moment.
Contrast-enhanced MR venography has the disadvantage that you need to give contrast, but has less pitfalls.
DSA
Angiography is only performed in severe cases, when an intervention is planned.
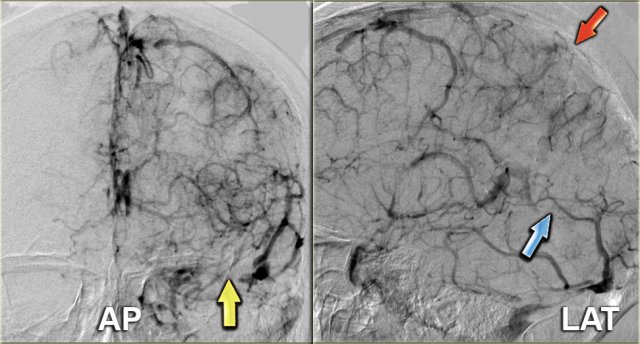
On the left images of a patient with venous thrombosis, who was unconsious and did not respond to anticoagulant therapy.
There is thrombosis of the superior sagittal sinus (red arrow), straight sinus (blue arrow) and transverse and sigmoid sinus (yellow arrow).
Continue with the video of the thrombectomy.
On the left a video of the thrombectomy.
Pitfalls in CT
Arachnoid Granulations
Arachnoid granulations are small protrusions of the arachnoid through the dura mater.
They protrude into the venous sinuses and may mimic filling defects caused by thrombus.
Usually these granulations are easily to differentiate from thrombosis.
 Normal transverse sinus (left) and thrombosed transverse sinus (right).
Mimick of dense clot sign
Normally veins are slightly denser than brain tissue and in some cases it is difficult to say whether it is normal or too dense.
In these cases a contrast enhanced scan is necessary to solve this problem.
On the left an image of a thrombosed transverse sinus and next to it a normal transverse sinus.
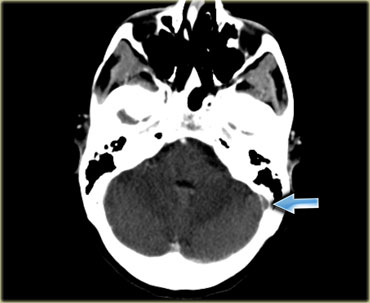
 Mimick of dense clot sign in an infant
In infants the brain is usually less dense than in older children and adults.
This results in a relative high density of the blood in the sagittal sinus compared to the brain, which simulates a dense clot sign.
 Hematoma mimicking a dense clot sign
Hematoma simulating dense clot sign.
Usually there is no problem in differentiating a hematoma from a thrombosed sinus.
Here a patient with a peripheral intracerebral hematoma.
Because it is located in the area of the transverse sinus it simulates a thrombosed transverse sinus.
Pseudo empty delta sign
Here a patient with a subdural hematoma on the left side, that has spread to the region of the superior sagittal sinus (arrows).
At first impression this looks like an empty delta sign.
By scrolling through the data set, it was obvious that it was an extention of the hematoma.
A hyperdense empyema can sometimes also mimick an empty delta sign.
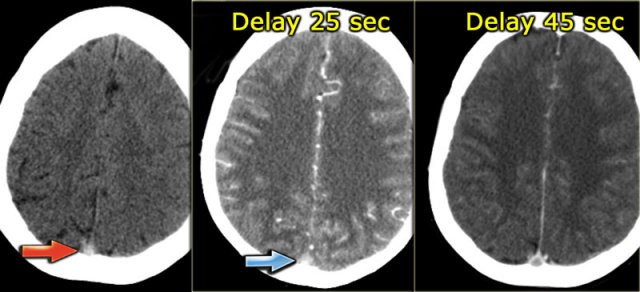
Wrong bolus timing
On the left three images of a patient with venous thrombosis in the superior sagittal sinus.
On the far left we see a dense vessel sign on the unenhanced CT.
In the middle an image made 25 seconds after the start of the contrast injection.
There is arterial enhancement and it looks as if the superior sagittal sinus enhances, but in fact what we see is the shine through of the dense thrombus.
Only on the image on the right, which was made 45 seconds after contrast injection there is an empty delta sign, which proves the presence of a thrombus in the sinus.
Pitfalls in MRI
Hypoplastic transverse sinus
Hypoplasia and aplasia of the right or left transverse sinus is a common finding.
It can easily be mistaken for sinus thrombosis, because on the MRA one of the transverse sinuses is missing.
When you suspect, that there is a hypoplastic transverse sinus, then you should look at the size of the jugular foramen.
On the left images of a patient with hypoplasia of the left transverse sinus.
Notice the size difference of the jugular foramen.
On the left a transverse MIP of phase-contrast images.
To differentiate whether there is a hypoplastic transverse sinus or thrombosed sinus, you need to look at the source images.
On the source image on the right you can see that there is no hypoplasia (blue arrow).
In this case there thrombosis of the left transverse sinus.
On the left another case that demonstrates that you cannot fully rely on phase contrast imaging.
The signal in the vein depends on the velocity of the flowing blood and the velocity encoding by the technician.
On the far left a patient with non visualization of the left transverse sinus.
This could be hypoplasia, venous thrombosis or slow flow.
On the contrast enhanced T1-weighted image it is obvious that the sinus fills with contrast and is patent.
 Thrombus in right transverse sinus is dark on T2 due to intracellular deoxyhemoglobin (Courtesy dr. Howard Rowley)
Low signal intensity in thrombus
Normally when there is low signal in a vein, it is attributed to flow void and a sign of patency of the vein.
However at some stage of the thrombus there is intracellular deoxyhemoglobin, which is dark on T2 and mimics flow void.
On the left there is a thrombosed right transverse sinus with a delta sign on the contrast enhanced image.
The sinus has a low signal intensity on the T2-weighted image as a result of the intracellular deoxyhemoglobin.
On the contrast enhanced T1-weighted image it is obvious that the sinus is filled with thrombus.
Flow void on contrast-enhanced MR
On the contrast enhanced T1 images on the left there is an area of low signal intensity within the enhancing transverse sinus.
This could easily been mistaken for a central thrombus within the sinus.
This however is the result of flow void.
Continue with the phase contrast images.
On the phase contrast images it is obvious that the transverse sinus is patent.
We can conclude that MRI has many false positives and negatives in the diagnosis of venous thrombosis. Contrast enhanced MR-venography is the most reliable MR technique. CT-venography is even more reliable, because it is easy and less sensitive to pitfalls.
Pitfalls in TOF imaging are:
- Signal loss due to in-plane flow.
- Flow simulated by T1-shine thru of methemoglobin within thrombus.
Chronic dural sinus thrombosis and related syndromes
DAVF
Chronic dural sinus thrombosis can lead to dural arteriovenous fistula formation and to increased CSF pressure.
A DAVF or dural arteriovenous fistula is an abnormal connection between dural arteries, which are branches of the external carotid with the venous sinuses.
Sinus thrombosis is seen in many patients with a dural arteriovenous fistula, but the pathogenesis is still unclear (10).
There are two possible mechanisms: (a) thrombophlebitis of the dural sinus may induce a dural fistula and (b) in the course of a dural fistula flow reversal may lead to thrombosis.
Current classifications of DAVF focus mainly on the presence of leptomeningeal reflux related to cerebral venous hypertension leading to cerebral venous infarction or hemorrhage.
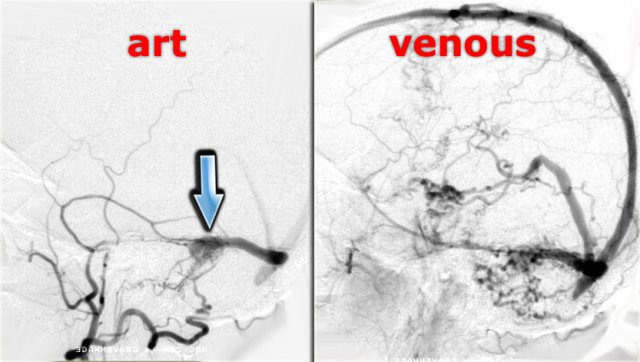
On the left DSA images of a patient with a DAVF.
Notice the direct communication between the branches of the external carotid artery and the transverse sinus (blue arrow).
Continue with the T2-weighted images.
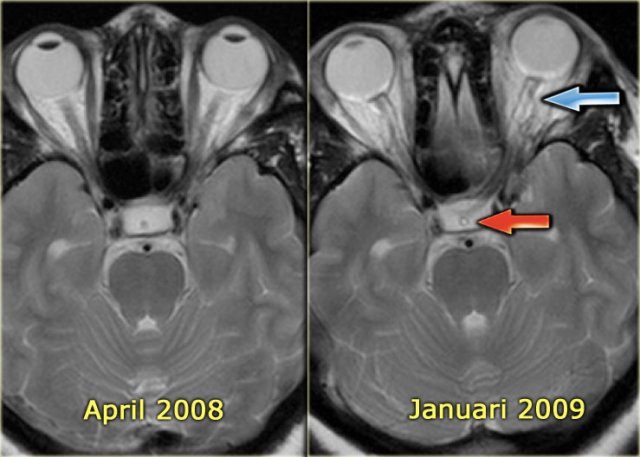
On the left T2-images during the follow up.
In april 2008 there were no abnormalities.
In january 2009 there are signs of intracranial hypertension like CSF surrounding the optic nerve and CSF within the stalk of the hypophysis.
Thrombosis and increased CSF pressure
In some patients dural sinus thrombosis may, even after recanalisation, lead to persisting disturbances in venous circulation.
This may lead to raised intracranial CSF pressure as assessed by lumbar puncture.
Clinically, these patients complain of headaches and they may have vision disturbances due to papil edema.
On MRI, one may see increased CSF around the optic nerve and an empty sella.
Apparently in some patients a residual stenosis persists.
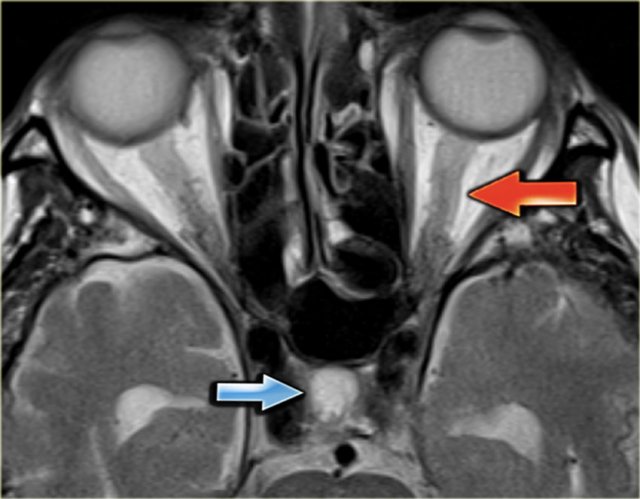
On the left a T2-weighted image demonstrating papil edema and an empty sella.
Continue with the sagittal T1-weighted image.
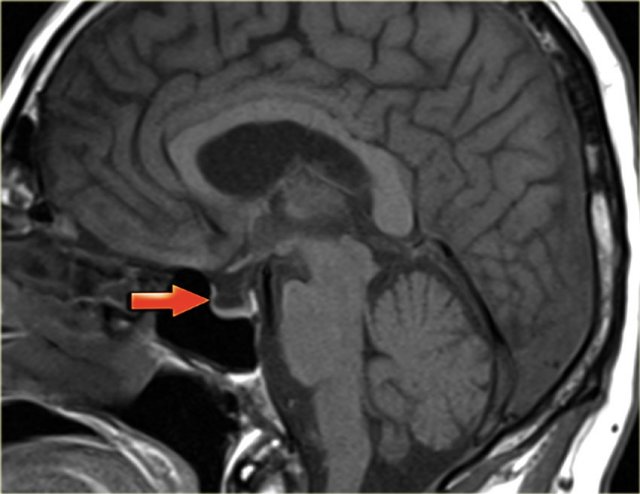
Here the sagittal T1-weighted image demonstrating the empty sella (arrow).
It is called an empty sella because the sella is mainly filled with CSF as the hypofysis is compressed downwards due to the increased intracranial pressure.
Venous territories
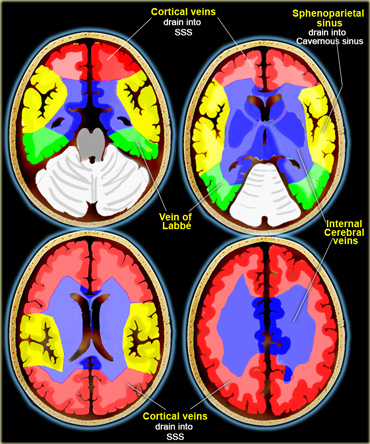
On the left an illustration of the territories of the venous drainage.
There is great variation in these territories and the illustration should be regarded as a rough guide.