Chest X-Ray - Heart Failure
Simone Cremers, Jennifer Bradshaw and Freek Herfkens
Radiology department of the Albert Schweitzer Hospital in Dordrecht and the Medical Centre Alkmaar, the Netherlands, the Netherlands
Publicationdate
In this article we will discuss the radiographic signs of congestive heart failure on the chest X-ray.
Introduction
Congestive heart failure (CHF) is the result of insufficient output because of cardiac failure, high resistance in the circulation or fluid overload.
Left ventricle (LV) failure is the most common and results in decreased cardiac output and increased pulmonary venous pressure.
In the lungs LV failure will lead to dilatation of pulmonary vessels, leakage of fluid into the interstitium and the pleural space and finally into the alveoli resulting in pulmonary edema.
Right ventricle (RV) failure is usually the result of long standing LV failure or pulmonary disease and causes increased systemic venous pressure resulting in edema in dependent tissues and abdominal viscera.
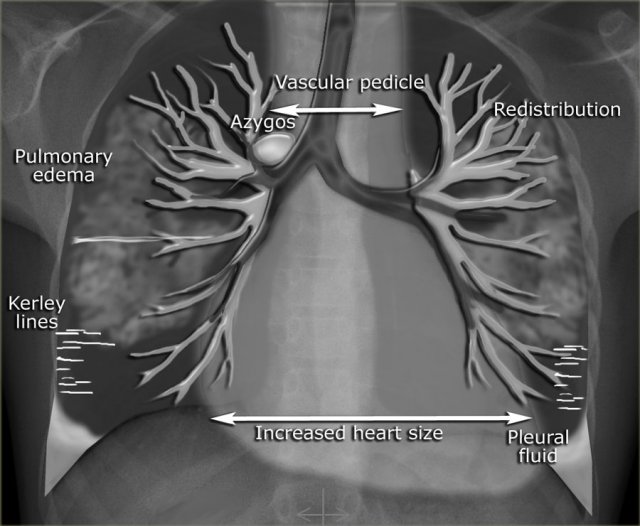
In the illustration on the left some of the features, that can be seen on a chest-film in a patient with CHF.
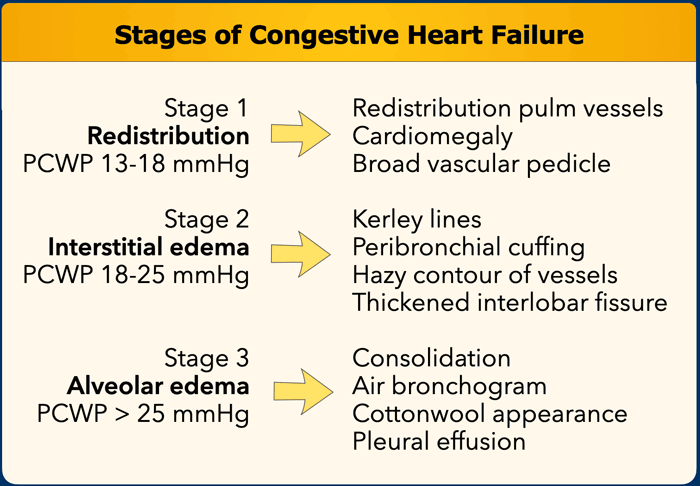
Increased pulmonary venous pressure is related to the pulmonary capillary wedge pressure (PCWP) and can be graded into stages, each with its own radiographic features on the chest film (Table).
This grading system provides a logical sequence of signs in congestive heart failure.
In daily clinical practice however some of these features are not seen in this sequence and sometimes may not be present at all.
This can be seen in patients with chronic heart failure, mitral valve disease and in chronic obstructive lung disease.
Congestive Heart Failure
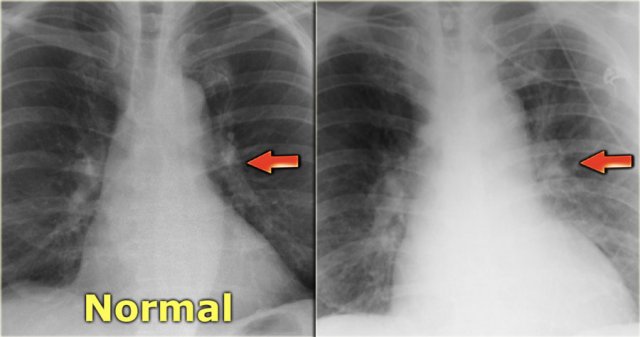
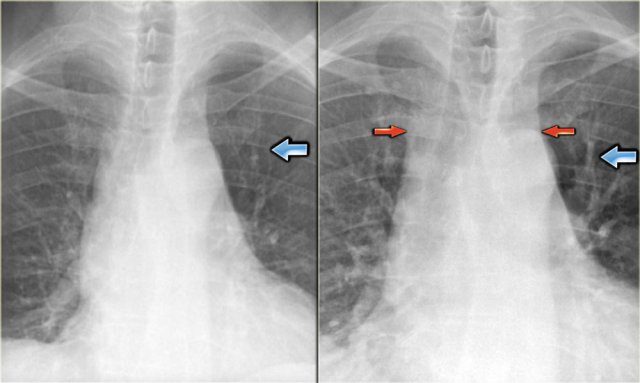 Views of the upper lobe vessels of a patient in good condition (left) and during a period of CHF (right). Notice also the increased width of the vascular pedicle (red arrows).
Stage I - Redistribution
In a normal chest film with the patient standing erect, the pulmonary vessels supplying the upper lung fields are smaller and fewer in number than those supplying the lung bases.
The pulmonary vascular bed has a significant reserve capacity and recruitment may open previously non-perfused vessels and causes distension of already perfused vessels.
This results in redistribution of pulmonary blood flow.
First there is equalisation of blood flow and subsequently redistribution of flow from the lower to the upper lobes.
The term redistribution applies to chest x-rays taken in full inspiration in the erect position.
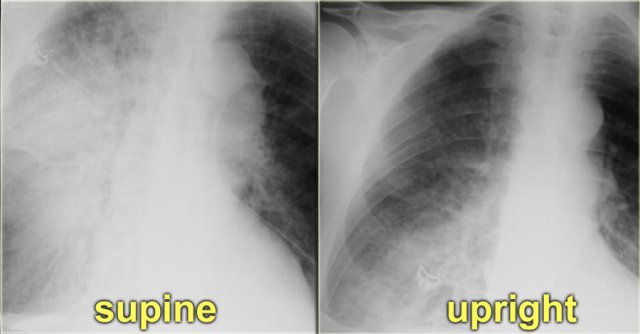
In daily clinical practice many chest films are taken in a supine or semi-erect position and the gravitational difference between the apex and the lung bases will be less.
In the supine position, there will be equalisation of blood flow, which may give the false impression of redistribution.
In these cases comparison with old fims can be helpful.
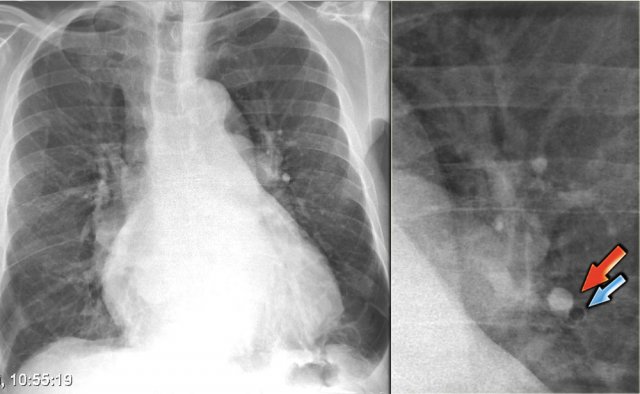 Increased artery-to-bronchus ratio in CHF
Artery-to-bronchus ratio
Normally the vessels in the upper lobes are smaller than the accompanying bronchus with a ratio of 0.85 (3).
At the level of the hilum they are equal and in the lower lobes the arteries are larger with a ratio of 1.35.
When there is redistribution of pulmonary blood flow there will be an increased artery-to-bronchus ratio in the upper and middle lobes.
This is best visible in the perihilar region.
On the left a patient with cardiomegaly and redistribution.
The upper lobe vessels have a diameter > 3 mm (normal 1-2 mm).
Notice the increased artery-to-bronchus ratio at hilar level (arrows).
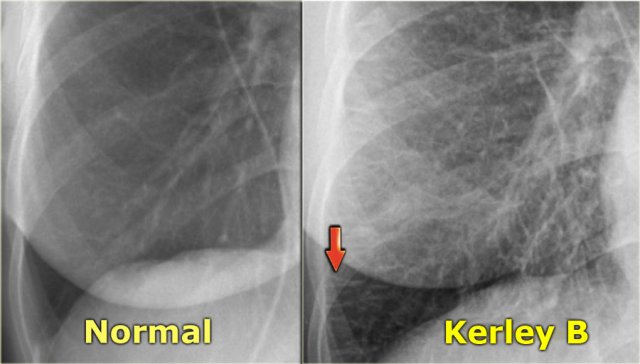 LEFT: normal. RIGHT: CHF stage II with Kerley B-lines due to interstitial edema
Stage II - Interstitial edema
Stage II of CHF is characterized by fluid leakage into the interlobular and peribronchial interstitium as a result of the increased pressure in the capillaries.
When fluid leaks into the peripheral interlobular septa it is seen as Kerley B or septal lines.
Kerley-B lines are seen as peripheral short 1-2 cm horizontal lines near the costophrenic angles.
These lines run perpendicular to the pleura.
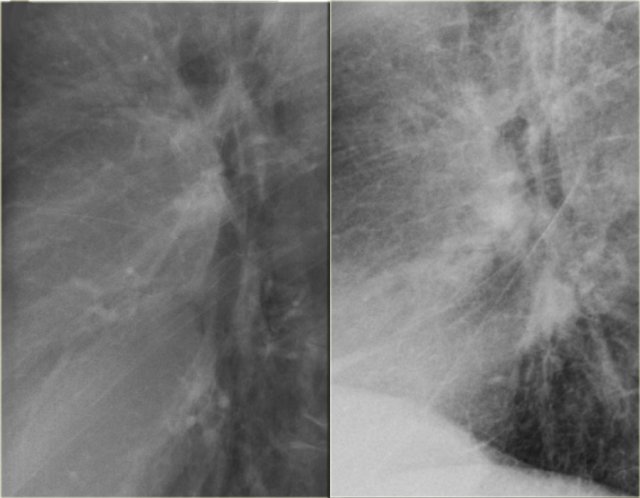
 Perihilar haze in interstitial stage of CHF
When fluid leaks into the peribronchovascular interstitium it is seen as thickening of the bronchial walls (peribronchial cuffing) and as loss of definition of these vessels (perihilar haze).
On the left a patient with congestive heart failure.
There is an increase in the caliber of the pulmonary vessels and they have lost their definition because they are surrounded by edema.
 Previous normal chest x-ray (left) and CHF stage II with perihilar haze (right)
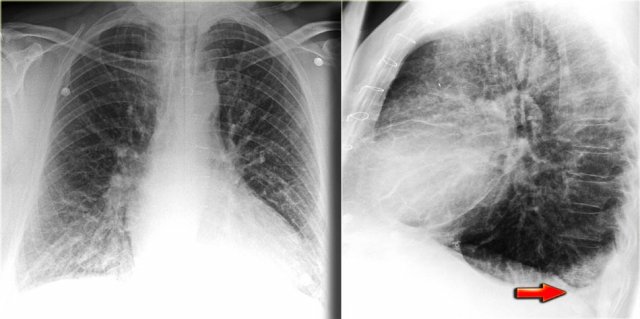
On the left another patient with congestive heart failure.
The lateral view nicely demonstrates the increased diameter of the pulmonary vessels and the hazy contours.
Notice also the septal lines and the accentuated interstitium.
Furthermore the fissura major is markedly thickened.
 Thickened septal lines due to interstitial edema in CHF
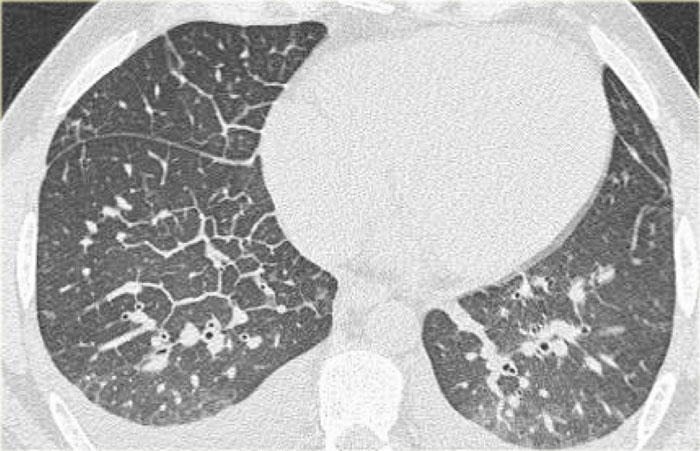
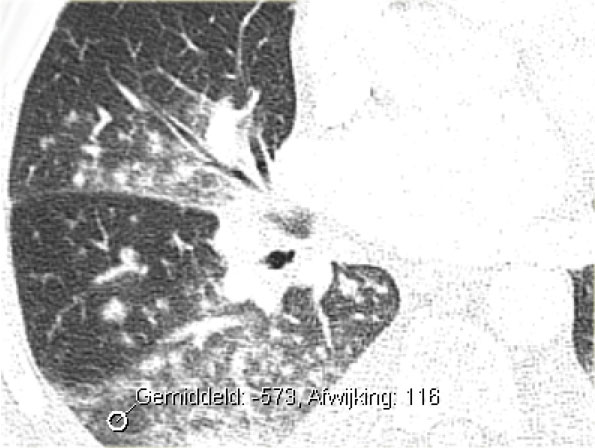
CT will also demonstrate signs of congestive heart failure.
On the image on the left notice the following:
- Thickened septal lines due to interstitial edema
- Subtle ground glass opacity in the dependent part of the lungs (HU difference of 100-150 between the dependent and non-dependent part of the lung).
- Bilateral pleural fluid.
In a patient with a known malignancy lymphangitic carcinomatosis would be high in the differential diagnostic list.
Ground glass opacity is the first presentation of alveolar edema and a precursor of consolidation.
Stage III - Alveolar edema
This stage is characterized by continued fluid leakage into the interstitium, which cannot be compensated by lymphatic drainage.
This eventually leads to fluid leakage in the alveoli (alveolar edema) and to leakage into the pleural space (pleural effusion).
The distribution of the alveolar edema can be influenced by:
- Gravity: supine or erect position and right or left decubitus position
- Obstructive lung disease, i.e. fluid leakage into the less severe diseased areas of the lung
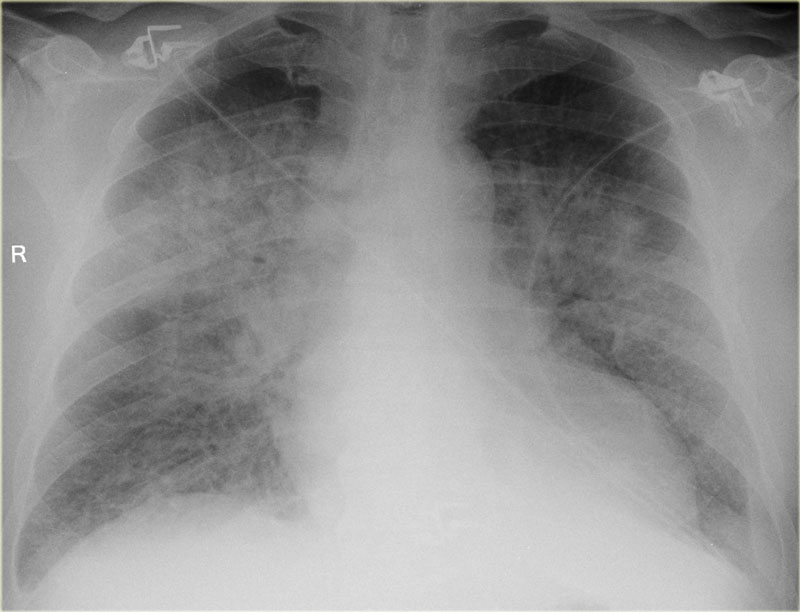
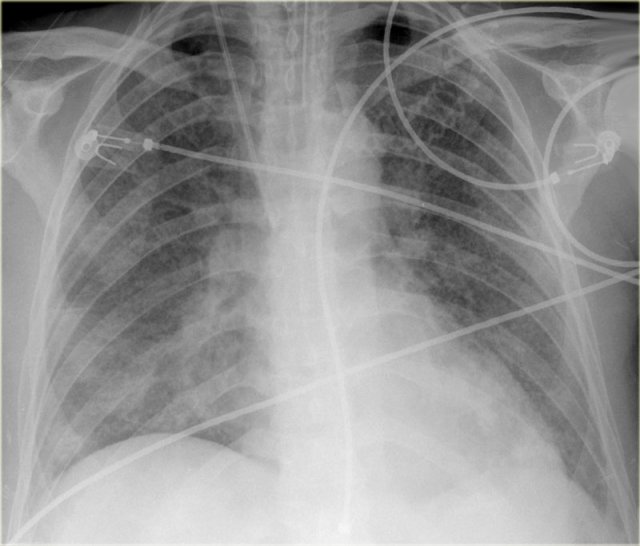
On the left a patient who was admitted with severe dyspnoe due to acute heart failure.
The following signs indicate heart failure: alveolar edema with perihilar consolidations and air bronchograms (yellow arrows); pleural fluid (blue arrow); prominent azygos vein and increased width of the vascular pedicle (red arrow) and an enlarged cardiac silhouette (arrow heads).
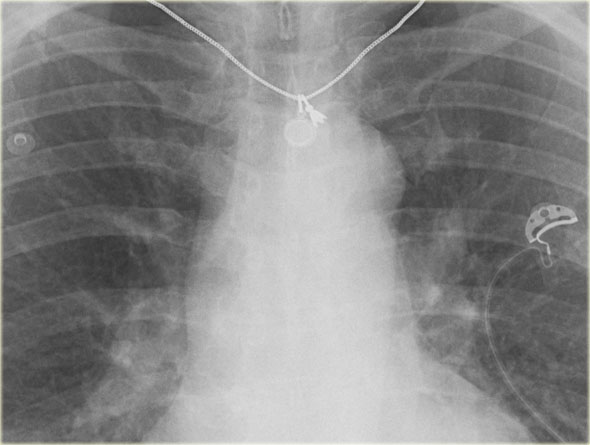
After treatment we can still see an enlarged cardiac silhouette, pleural fluid and redistribution of the pulmonary blood flow, but the edema has resolved.
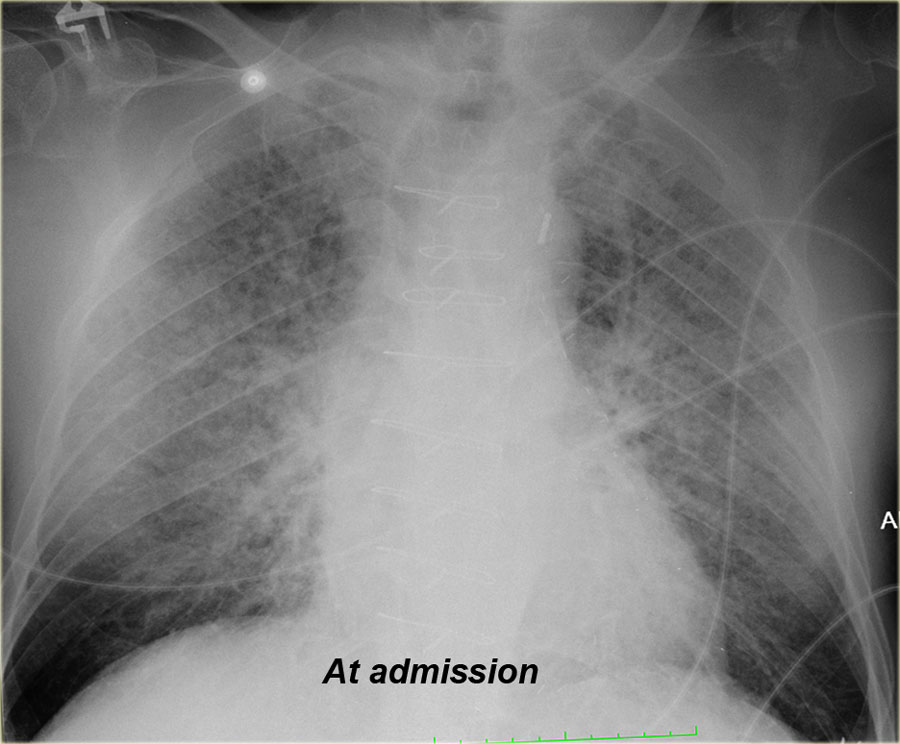
On the left another patient with alveolar edema at admission, which resolved after treatment.
When you scroll through the images and go back and forth, you will notice the difference in vascular pedicle width and distribution of pulmonary flow.
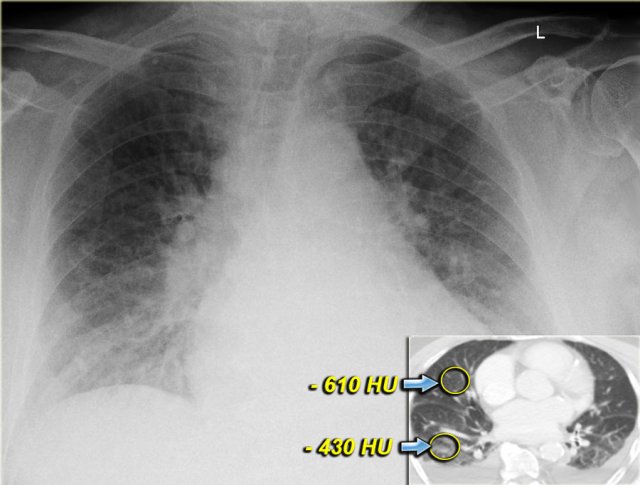
Both on the chest x-ray and on the CT the edema is gravity dependent and differences in density can be measured.
Notice that even within each lobe there is a gravity dependent difference in density.
This is only seen when the consolidations are the result of transudate like in CHF.
This is not seen when the consolidations are the result of exsudate due to infection, blood due to hemorrhage or when there is a capillary leak like in ARDS.
On the left a patient who first had a chest film in a supine position.
Notice the pulmonary edema, which is almost exclusively seen in the right lung.
A possible explanation for this phenomenon could be, that the patient had been lying on his right side for a while before the x-ray was taken.
Cardiothoracic ratio
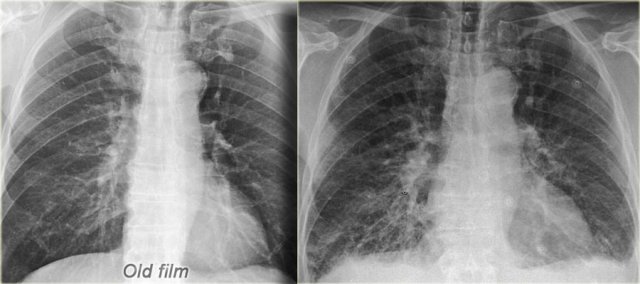 Old film for comparison (left) CHF with redistribution, interstitial edema and some pleural fluid
The cardiothoracic ratio (CTR) is the ratio of the transverse diameter of the heart to the internal diameter of the chest at its widest point just above the dome of the diaphragm as measured on a PA chest film.
An increased cardiac silhouette is almost always the result of cardiomegaly, but occasionally it is due to pericardial effusion or even fat deposition.
The heart size is considered too large when the CTR is > 50% on a PA chest x-ray.
A CTR of > 50% has a sensitivity of 50% for CHF and a specificity of 75-80%.
An increase in left ventricular volume of at least 66% is necessary before it is noticeable on a chest x-ray.
On the left a patient with CHF.
There is an increase in heart size compared to the old film.
Other signs of CHF are visible, such as redistribution of pulmonary flow, interstitial edema and some pleural fluid.
On a supine film the cardiac silhouette will be larger due to magnification and high position of the hemidiafragms.
Exact measurements are not that helpful, but comparison to old supine films can be of value.
 Increased CTR due to pericardial effusion
On the left a patient, who recently underwent a valve replacement.
There is a large cardiac silhouette, which could be the result of cardiomegaly.
Because of the recent cardiac surgery, the possibility of pericardial effusion was taken into account, which is nicely demonstrated on the CT-image.
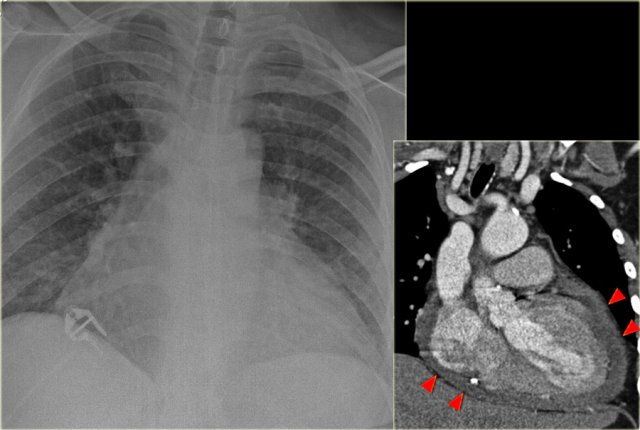
On the left another patient with a large cardiac silhouette on the chest x-ray due to pericardial effusion.
Pericardial effusion is demonstrated on the coronal CT-reconstruction.
Pleural effusion
 Pleural effusion more evident on lateral view
Pleural effusion is bilateral in 70% of cases of CHF.
When unilateral, it is slightly more often on the right side than on the left side.
There has to be at least 175 ml of pleural fluid, before it will be visible on a PA image as a meniscus in the costophrenic angle.
On a lateral image effusion of > 75 ml can be visible.
If pleural effusion is seen on a supine chest film, it means that there is at least 500 ml present.
On the left images of a patient who has bilateral pleural effusions.
Notice that it is more evident on the lateral view.
 Subpulmonic pleural effusion with increased distance of the stomach air bubble to the lung base (arrow)
Pleural effusion is not always visible as a meniscus in the costophrenic angle.
A subpulmonic effusion may follow the contour of the diaphragm making it tricky to discern.
In these cases, the only way to detect pleural effusion, is when you notice that there is an increased distance between the stomach bubble and the lung.
The stomach is normally located directly under the diaphragm, so, on an erect PA radiograph, the stomach bubble should always appear in close proximity to the diaphragm and the lung.
On the left images of a patient with signs of CHF.
At first glance you might get the impression that there is a high position of the diaphragm.
However when you notice the increased distance of the stomach air bubble to the lung base, you realize that there is a large amount of pleural fluid on both sides (arrow).
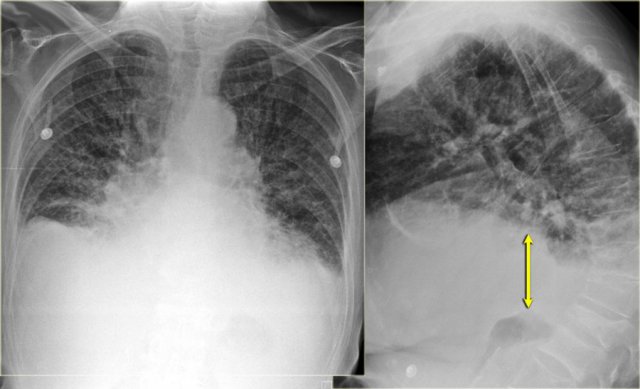
Vascular pedicle
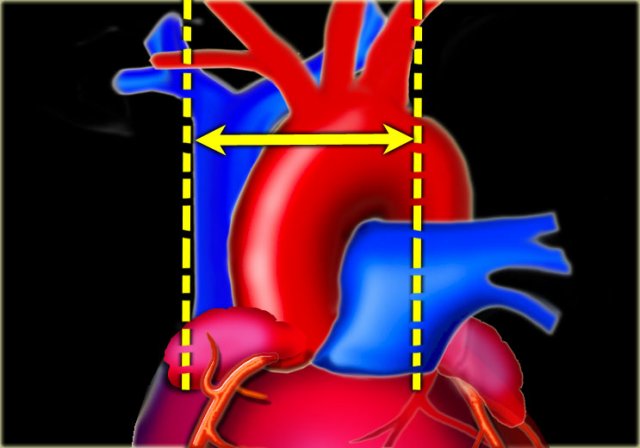
The vascular pedicle is bordered on the right by the superior vena cava and on the left by the left subclavian artery origin (6).
The vascular pedicle is an indicator of the intravascular volume.
A vascular pedicle width less than 60 mm on a PA chest radiograph is seen in 90% of normal chest x-rays.
A vascular pedicle width of more than 85 mm is pathologic in 80% of cases.
5 mm increase in diameter corresponds to 1 liter increase of intravascular fluid.
An increase in width of the vascular pedicle is accompanied by an increased width of the azygos vein.
 Subtle increased width of vascular pedicle (left) and normalisation (right)
There are three principal varieties of pulmonary edema: cardiac,
overhydration and increased capillary permeability (ARDS).
The vascular pedicle width (VPW) can help in differentiating these different forms of pulmonary edema (6):
- Normal VPW: most common in capillary permeability or acute cardiac failure.
- Widened VPW: most common in overhydration/renal failure and chronic cardiac failure.
- Narrowed VPW: most common in capillary permeability.
 Normal VPW in a patient with ARDS
On the left a patient with ARDS.
There is alveolar edema in both lungs.
Notice that the VPW is normal.
The vessels in the upper lobes are not dilated and the cardiac silhouette is not enlarged.
The VPW is best used as a measure to compare serial chest x-rays of the same patient, as there is a wide range of values for the VPW.
The VPW may increase due to rotation to the right.
On an AP-view the VPW will increase 20% compared to a PA-view.
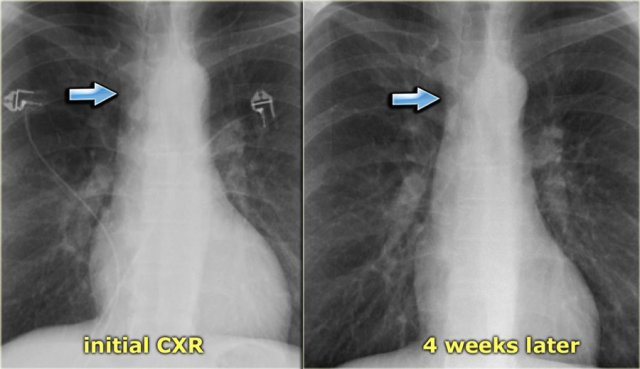
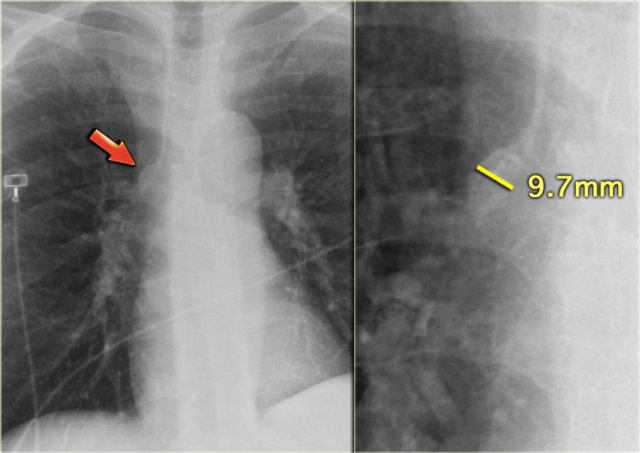
On the left a patient with subtle signs of congestive heart failure on the initial chest x-ray (image 1/2).
There is a slightly enlarged vascular pedicle, which becomes more obvious when you compare to the chest film after diuretic therapy (image 2/2).
Dilatation of azygos vein
Dilation of the azygos vein is a sign of increased right atrial pressure and is usually seen when there is also an increase in the width of the vascular pedicle.
The diameter of the azygos vein varies according to the positioning.
In the standing position a diameter > 7 mm is most likely abnormal and a diameter > 10 mm is definitely abnormal.
In a supine patient > 15 mm is abnormal.
An increase of 3 mm in comparison to previous films is suggestive of fluid overload.
The difference of the azygos diameter on an inspiration film compared to an expiration film is only 1mm.
This means that the diameter of the azygos is a valuable tool whether or not there is good inspiration.
Right ventricular failure
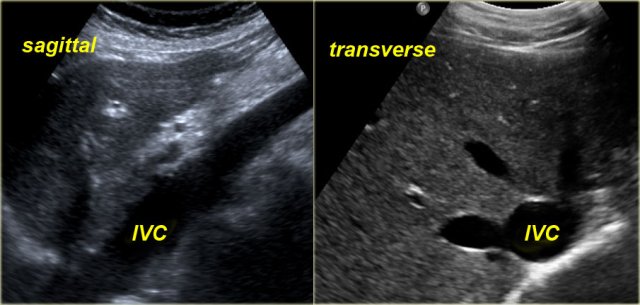 Dilatation of IVC and hepatic veins on US images in a patient with RV failure
RV failure is most commonly caused by longstanding LV failure, which increases the pulmonary venous pressure and leads to pulmonary arterial hypertension, thus overloading the RV.
Other less common causes of RV failure are:
- Severe lung disorder (cor pulmonale)
- Multiple pulmonary emboli
- RV infarction
- Primary pulmonary hypertension
- Tricuspid regurgitation or stenosis, mitral stenosis and pulmonary valve stenosis.
Radiographic signs of RV failure:
- Increased VPW due to dilatation of the superior vena cava
- Dilatation of azygos vein
- Dilatation of the right atrium
- In many cases there will be both signs of RV and LV failure
Sonographic signs of RV failure:
- Dilatation of the inferior vena cava (IVC) and hepatic veins
- Hepatomegaly
- Ascites
The indication for ultrasound examination in many of these patients is abnormal liver function tests.
It is therefore important to consider the possibility of RV failure when a patient presents with liver enzyme abnormalities.

Under normal conditions dynamic ultrasound will demonstrate changes in caliber of the IVC.
These changes in caliber can be attributed to variations in blood flow in the IVC in accordance with the respiratory and cardiac cycles.