RECIST 1.1 - examples
Fokko Smits, Martijn Dirksen and Ivo Schoots
Radiology Department of the Erasmus MC in Rotterdam and the Isala hospital in Zwolle, the Netherlands
In this article some examples of tumor response to therapy are given.
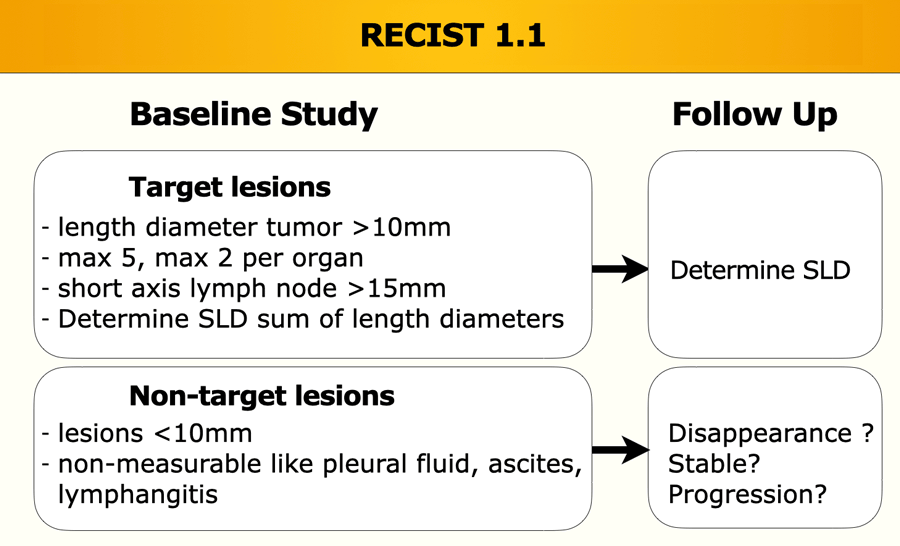
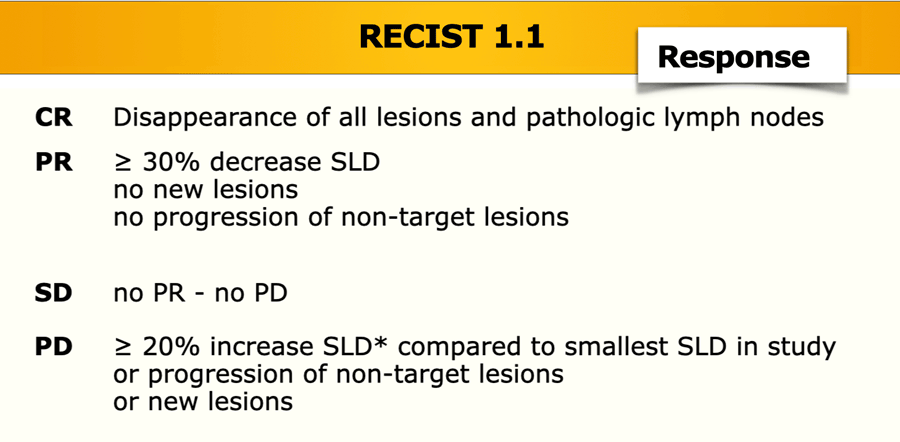
The response categories are complete response, partial response (30% decrease in sum of length diameters -SLD from baseline), stable disease and progressive disease (20% increase in sum from baseline or Nadir).
Nadir is the best result during therapy with the smallest SLD.
Introduction
Complete Response
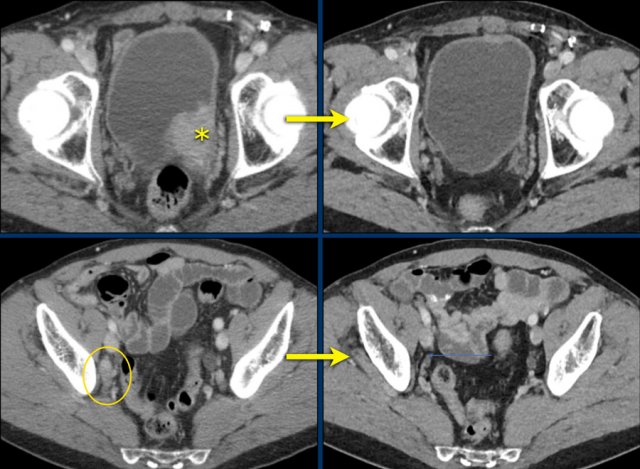
CT-images in a 65-year-old male with bladdercarcinoma and lymph node metastasis (< 15 mm) in the right obturator region.
During treatment with immunotherapy the bladder lesion (target) and lymphadenopathy (non-target) completely disappeared.
This is a complete response.
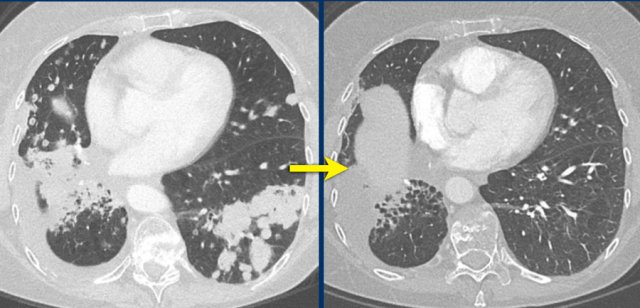
CT images in a 58-year-old male with stadium 4 lung cancer, contralateral pulmonary, lymph node and osseous metastases, and previous treatment with lobectomy of the right lower lobe and chemoradiotherapy.
CT image on the right at response evaluation during treatment with immunotherapy shows complete disappearance of pulmonary metastases.
Does this mean CR?
Continue to the next images.
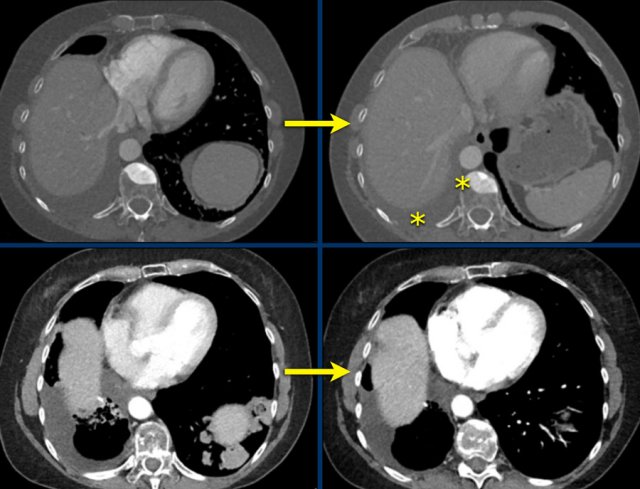
Although the lungmetastases have disappeared, other images showed unchanged sclerotic bone lesions and pleural effusion.
This makes it impossible to assign complete response, unless these lesions are proven not to be viable or malignant by FDG-PET or cytology.
Stable Disease
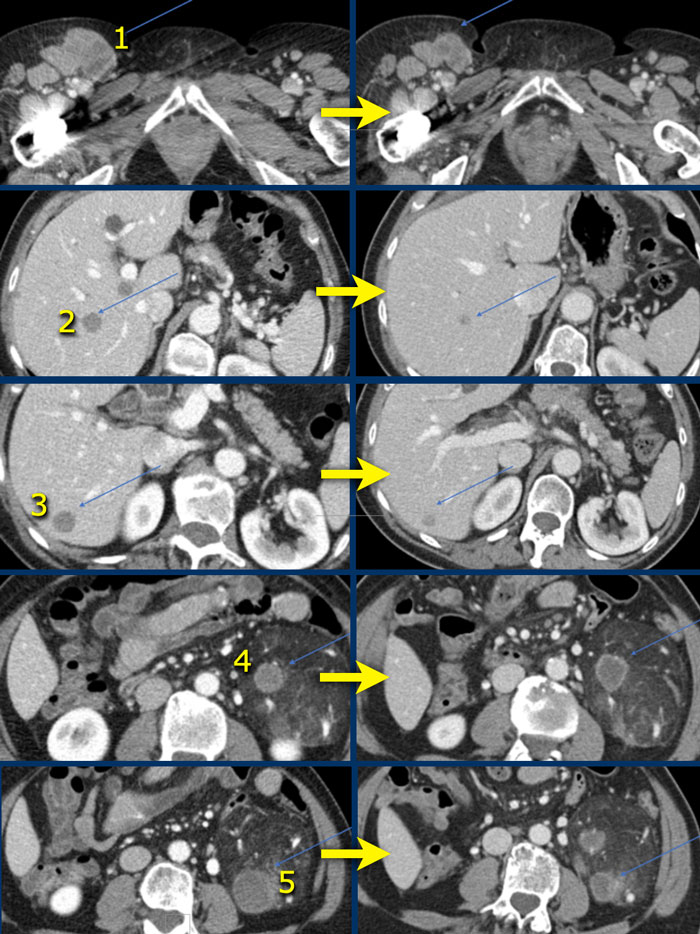
CT images in a 63-year-old male with a melanoma and metastases of melanoma in the liver and inguinal lymph nodes.
There also was a renal angiomyelolipoma, which was a coincidental finding.
Target lesions:
- Inguinal lymph node: 34 mm > 25 mm
- Liver lesion: 19 mm > 12 mm
- Liver lesion: 16 mm > 10 mm
- AML lesion: 19 mm > 25 mm
- AML lesion: 33 mm > 23 mm
Non-target lesions:
- Other inguinal lymph nodes: regression
- Other liver lesions: regression
- Other AML lesions: regression.
New lesions:
- No
Baseline SLD = 121
Follow-up SLD = 95
Percentage of decrease from baseline study is 21%, which means stable disease (SD).
 Stable disease. Increase from baseline is 14%.
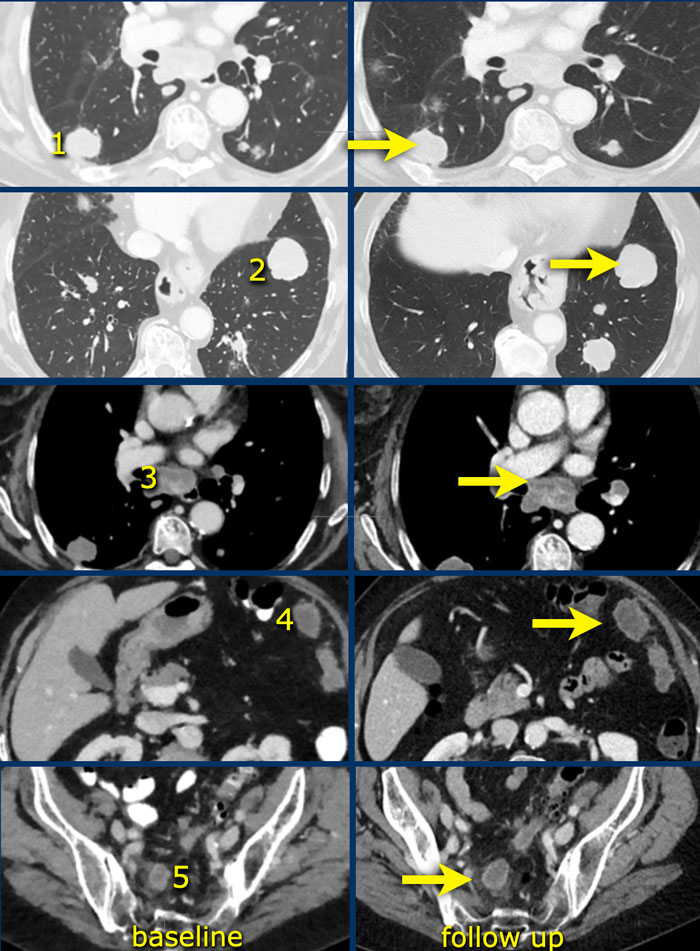
CT images in a 71-year-old female with endometrial cancer with lung, lymph node and peritoneal metastases. Baseline images on the left and images at the first response evaluation during treatment with chemotherapy on the right.
Target lesions:
- Lung lesion: 26 mm > 31 mm
- Lung lesion: 35 mm > 38 mm
- Lymph node carinal: 23 mm > 24 mm
- Peritoneal lesion: 31 mm > 37 mm
- Peritoneal lesion: 23 mm > 27 mm
Non-target lesions:
- Other lung lesions: slightly increased
- Other mediastinal lymph nodes: slightly increased
- Other peritoneal lesion: slightly increased
New lesions:
- No
Baseline SLD = 138
Follow-up SLD = 157
Percentage increase from baseline/nadir is 14%, which means that this is stable disease (SD).
Progressive Disease
New Lesions
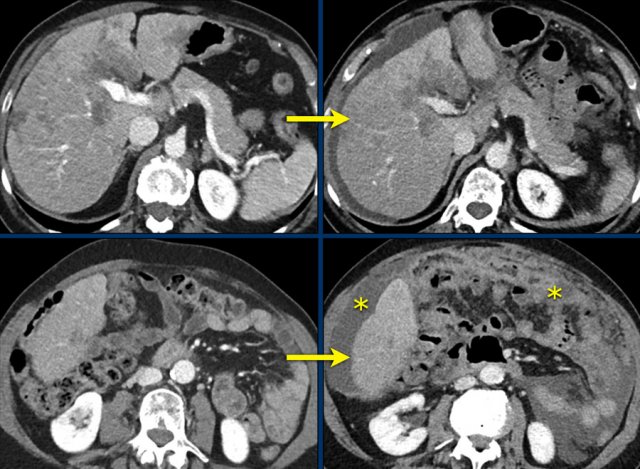
CT images of a 66-year-old female with confluencing liver metastases of a mammacarcinoma.
Confluencing hepatic lesions, chosen as target and non target lesions, are stable or regress marginally during treatment with hormone therapy.
However, new peritoneal metastases appear with omental cake and ascites.
This means progressive disease.
Not Measurable

CT images in a 59-year-old female with bone metastases of breast carcinoma during treatment with second line treatment with chemotherapy.
The bone metastases become more sclerotic during treatment, and if you look closely they were already present at the baseline examination.
The lesions do not change in size or number.
This sclerotic change of bone metastases represents a good response.