Imaging in Acute Stroke
Majda Thurnher
Department of Radiology, Medical University of Vienna
Publicationdate
This review is based on a presentation given by Majda Thurnher and was adapted for the Radiology Assistant by Robin Smithuis.
We will discuss the following subjects:
- Role of CT and MR in patients with stroke
- Early CT and MR signs of infarction
- How to identify patients with tissue at risk for guidance in selecting the appropriate therapy
Introduction
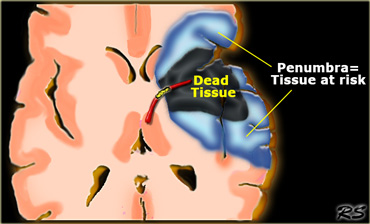
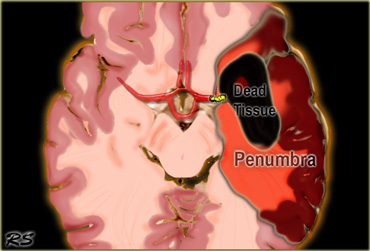 Penumbra: Occlusion of the MCA with irreversibly affected or dead tissue in black and tissue at risk or penumbra in red.
The goal of imaging in a patient with acute stroke is:
- Exclude hemorrhage
- Differentiate between irreversibly affected brain tissue and reversibly impaired tissue (dead tissue versus tissue at risk)
- Identify stenosis or occlusion of major extra- and intracranial arteries
In this way we can select patients who are candidates for thrombolytic therapy.
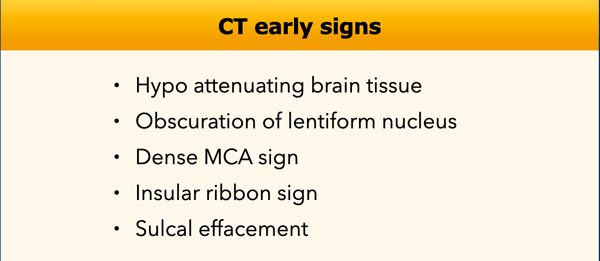
CT Early signs of ischemia
CT has the advantage of being available 24 hours a day and is the gold standard for hemorrhage.
Hemorrhage on MR images can be quite confusing.
On CT 60% of infarcts are seen within 3-6 hrs and virtually all are seen in 24 hours.
The overall sensitivity of CT to diagnose stroke is 64% and the specificity is 85%.
In the table on the left the early CT-signs of cerebral infarction are listed.
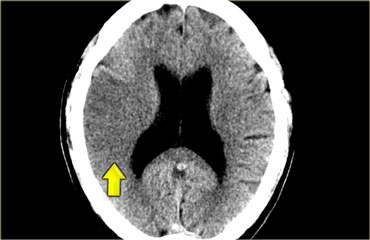 MCA infarction: on CT an area of hypoattenuation appearing within six hours is highly specific for irreversible ischemic brain damage.
Hypo attenuating brain tissue
The reason we see ischemia on CT is that in ischemia cytotoxic edema develops as a result of failure of the ion-pumps.
These fail due to an inadequate supply of ATP.
An increase of brain water content by 1% will result in a CT attenuation decrease of 2.5 HU.
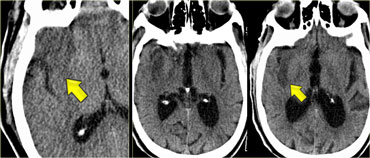
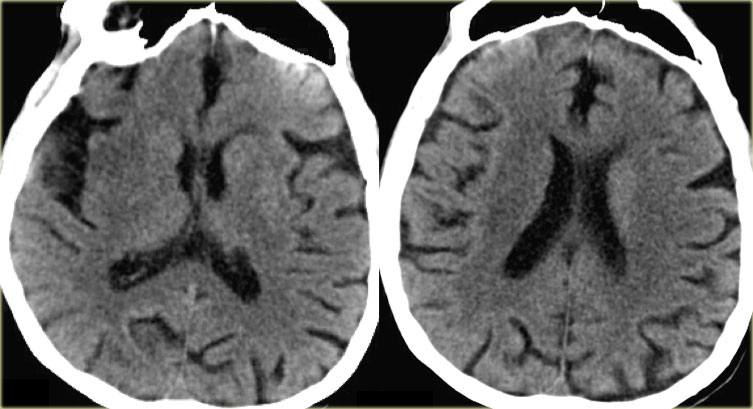
On the left a patient with hypoattenuating brain tissue in the right hemisphere.
The diagnosis is infarction, because of the location (vascular territory of the middle cerebral artery (MCA) and because of the involvement of gray and white matter, which is also very typical for infarction.

Hypoattenuation on CT is highly specific for irreversible ischemic brain damage if it is detected within first 6 hours (1).
Patients who present with symptoms of stroke and who demonstrate hypodensity on CT within first six hours were proven to have larger infarct volumes, more severe symptoms, less favorable clinical courses and they even have a higher risk of hemorrhage.
Therefore whenever you see hypodensity in a patient with stroke this means bad news.
No hypodensity on CT is a good sign.
 Obscuration of the lentiform nucleus or blurred basal ganglia
Obscuration of the lentiform nucleus
Obscuration of the lentiform nucleus, also called blurred basal ganglia, is an important sign of infarction.
It is seen in middle cerebral artery infarction and is one of the earliest and most frequently seen signs (2).
The basal ganglia are almost always involved in MCA-infarction.
 Two patients with insular ribbon sign
Insular Ribbon sign
This refers to hypodensity and swelling of the insular cortex.
It is a very indicative and subtle early CT-sign of infarction in the territory of the middle cerebral artery.
This region is very sensitive to ischemia because it is the furthest removed from collateral flow.
It has to be differentiated from herpes encephalitis.
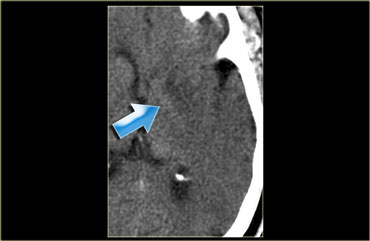
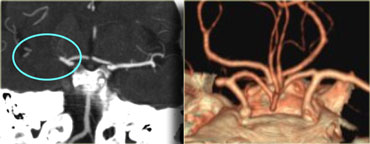
Dense MCA sign
This is a result of thrombus or embolus in the MCA.
On the left a patient with a dense MCA sign.
On CT-angiography occlusion of the MCA is visible.
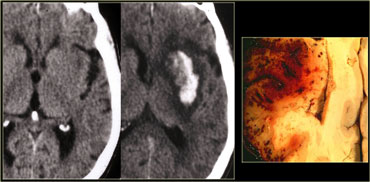
Hemorrhagic infarcts
15% of MCA infarcts are initially hemorrhagic.
Hemorrhage is most easily detected with CT, but it can also be visualized with gradient echo MR-sequences.
CTA and CT Perfusion
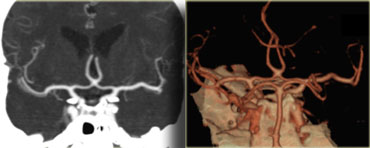 Normal CTA
Once you have diagnosed the infarction, you want to know which vessel is involved by performing a CTA.
First look at the images on the left and try to detect the abnormality.
Then continue reading.
The findings in this case are very subtle.
There is some hypodensity in the insular cortex on the right, which is the area we always look at first.
In this case it is suggestive for infarction, but sometimes in older patients with leukencephalopathy it can be very difficult.
A CTA was performed (see next images).
Now we feel very comfortable with the diagnosis of MCA infarction.
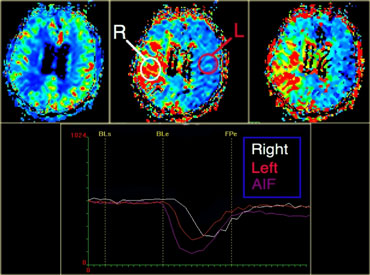
CT Perfusion (CTP)
With CT and MR-diffusion we can get a good impression of the area that is infarcted, but we cannot preclude a large ischemic penumbra (tissue at risk).
With perfusion studies we monitor the first pass of an iodinated contrast agent bolus through the cerebral vasculature.
Perfusion will tell us which area is at risk.
Approximately 26% of patients will require a perfusion study to come to the proper diagnosis.
The limitation of CT-perfusion is the limited coverage.
Studies were performed to compare CT with MRI to see how much time it took to perform all the CT studies that were necessary to come to a diagnosis.
It was demonstrated that Plain CT, CTP and CTA can provide comprehensive diagnostic information in less than 15 minutes, provided that you have a good team.
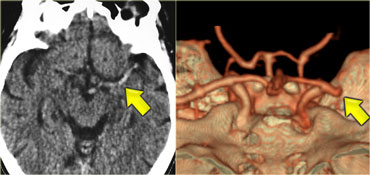
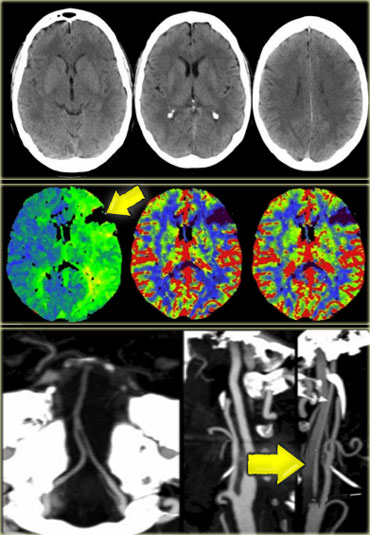
In the case on the left first a non-enhanced CT was performed.
If there is hemorrhage, then no further studies are necessary.
In this case the CT was normal and a CTP was performed, which demonstrated a perfusion defect.
A CTA was subsequently performed and a dissection of the left internal carotid was demonstrated.
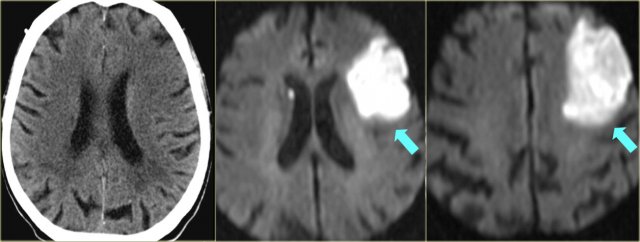
MRI
On PD/T2WI and FLAIR infarction is seen as high SI.
These sequences detect 80% of infarctions before 24 hours.
They may be negative up to 2-4 hours post-ictus!
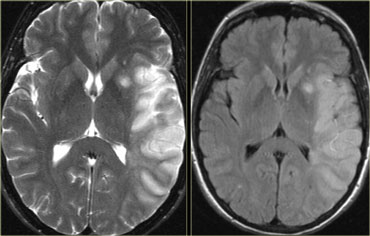
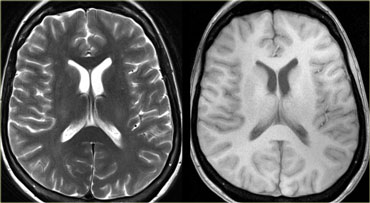
On the left T2WI and FLAIR demonstrating hyperintensity in the territory of the middle cerebral artery.
Notice the involvement of the lentiform nucleus and insular cortex.

High signal on conventional MR-sequences is comparable to hypodensity on CT.
It is the result of irreversible injury with cell death.
So hyperintensity means BAD news: dead brain.
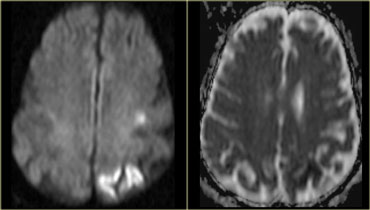
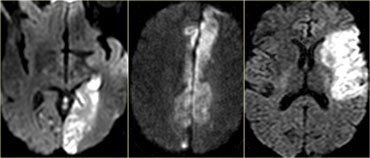 DWI in posterior, anterior and middle cerebral infarction
Diffusion Weighted Imaging (DWI)
DWI is the most sensitive sequence for stroke imaging.
DWI is sensitive to restriction of Brownian motion of extracellular water due to imbalance caused by cytotoxic edema.
Normally water protons have the ability to diffuse extracellularly and loose signal.
High intensity on DWI indicates restriction of the ability of water protons to diffuse extracellularly.
First look at the images on the left and try to detect the abnormality.
Then continue reading.
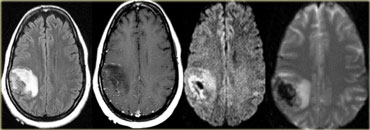
The findings in this case are very subtle.
There is some hypodensity and swelling in the left frontal region with effacement of sulci compared with the contralateral side.
You probably only notice these findings because this is an article about stroke and you would normally read this as 'no infarction'.
Now continue with the DWI images of this patient.
When we look at the DWI-images it is very easy and you don't have to be an expert radiologist to notice the infarction.
This is why DWI is called 'the stroke sequence'.
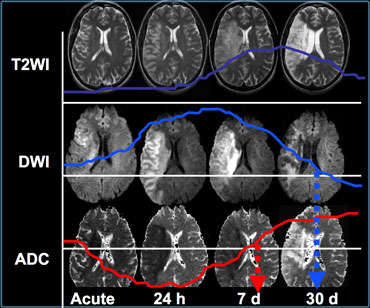 Signal intensities on T2WI and DWI in time (courtesy Dr M. Law)
When we compare the findings on T2WI and DWI in time we will notice the following:
- In the acute phase T2WI will be normal, but in time the infarcted area will become hyperintense.
- The hyperintensity on T2WI reaches its maximum between 7 and 30 days. After this it starts to fade.
- DWI is already positive in the acute phase and then becomes more bright with a maximum at 7 days.
- DWI in brain infarction will be positive for approximately for 3 weeks after onset (in spinal cord infarction DWI is only positive for one week!).
- ADC will be of low signal intensity with a maximum at 24 hours and then will increase in signal intensity and finally becomes bright in the chronic stage.
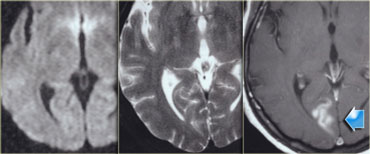 Pseudo-normalization of DWI in a 2 weeks old posterior infarction.
Pseudo-normalization of DWI
This occurs between 10-15 days.
The case on the left shows a normal DWI.
On T2WI there is may be some subtle hyperintensity in the right occipital lobe in the vascular territory of the posterior cerebral artery.
The T1WI after the administration of Gadolinium shows gyral enhancement indicating infarction.
First it was thought that everything that is bright on DWI is dead tissue.
However now there are some papers suggesting that probably some of it may be potentially reversible damage.
If you compare the DWI images in the acute phase with the T2WI in the chronic phase, you will notice that the affected brain volume in DWI is larger compared to the final infarcted area (respectively 62cc and 17cc).
Perfusion MR Imaging
Perfusion with MR is comparable to perfusion CT.
A compact bolus of Gd-DTPA is delivered through a power injector.
Multiple echo-planar images are made with a high temporal resolution.
T2* gradient sequences are used to maximize the susceptibility signal changes.
The area with abnormal perfusion can be dead tissue or tissue at risk.
Combining the diffusion and perfusion images helps us to define the tissue at risk, i.e. the penumbra.
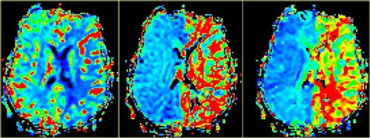
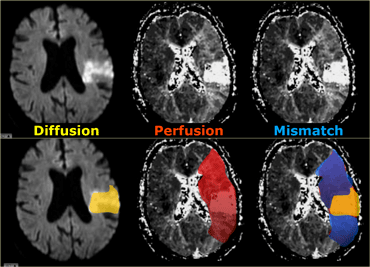 Diffusion in yellow. Perfusion in red. Mismatch in blue is penumbra.
On the left we first have a diffusion image indicating the area with irreversible changes (dead tissue).
In the middle there is a large area with hypoperfusion.
On the right the diffusion-perfusion mismatch is indicated in blue.
This is the tissue at risk.
This is the brain tissue that maybe can be saved with therapy.
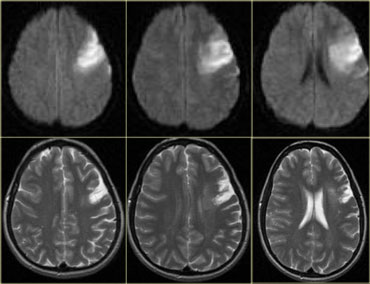
 T2WI and PDWI in a patient with sudden onset of neurological symptoms.
On the left a patient with sudden onset of neurological symptoms.
MR was performed 1 hour after onset of symptoms.
First look at the images on the left and try to detect the abnormality.
Then continue reading.
These images are normal and we have to continue with DWI.
See next images.
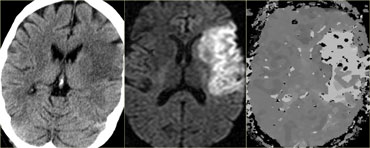
 DWI and PI
On the DWI there is a large area with restricted diffusion in the territory of the right middle cerebral artery.
Notice also the involvement of the basal ganglia.
There is a perfect match with the perfusion images, so this patient should not undergo any form of thrombolytic therapy.
On the left another MCA infarction.
It is clearly visible on CT (i.e. irreversible changes).
There is a match of DWI and Perfusion, so no therapy.
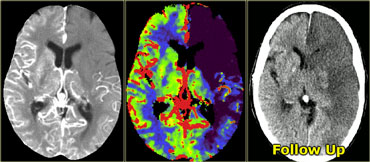
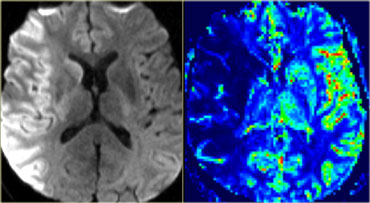
On the left another case.
The DWI and ADC map is shown.
Continue for the perfusion images
 Perfusion images demonstrating large penumbra
Now we can see that there is a severe mismatch.
Almost the whole left cerebral hemisphere is at risk due to hypoperfusion.
This patient is an ideal candidate for therapy.